This article does not cite any sources. Please help improve this article by adding citations to reliable sources. Unsourced material may be challenged and removed. Find sources: "Economic graph" – news · newspapers · books · scholar · JSTOR(June 2019) (Learn how and when to remove this message)
For the LinkedIn feature, see LinkedIn § Economic_graph.
The social science of economics makes extensive use of graphs to better illustrate the economic principles and trends it is attempting to explain. Those graphs have specific qualities that are not often found (or are not often found in such combinations) in other sciences.
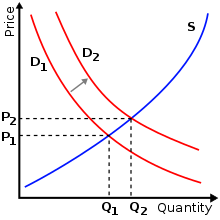
The supply and demand model describes how prices vary as a result of a balance between product availability and demand. The graph depicts an increase (that is, right-shift) in demand from D1 to D2 along with the consequent increase in price and quantity required to reach a new equilibrium point on the supply curve (S).
A common and specific example is the supply-and-demand graph shown at right. This graph shows supply and demand as opposing curves, and the intersection between those curves determines the equilibrium price. An alteration of either supply or demand is shown by displacing the curve to either the left (a decrease in quantity demanded or supplied) or to the right (an increase in quantity demanded or supplied); this shift results in new equilibrium price and quantity.
Economic graphs are presented only in the first quadrant of the Cartesian plane when the variables conceptually can only take on non-negative values (such as the quantity of a product that is produced). Even though the axes refer to numerical variables, specific values are often not introduced if a conceptual point is being made that would apply to any numerical examples.
More generally, there is usually some mathematical model underlying any given economic graph. For instance, the commonly used supply-and-demand graph has its underpinnings in general price theory—a highly mathematical discipline.
makes extensive use of graphs to better illustrate the economic principles and trends it is attempting to explain. Those graphs have specific qualities...
analytics Inspired by Facebook's "social graph", LinkedIn CEO Jeff Weiner set a goal in 2012 to create an "economicgraph" within a decade. The goal was to create...
contains more than 100 economic, environmental and social indicators, each presented with a clear definition, tables, and graphs. The Factbook mainly focuses...
Sometimes an economic hypothesis is only qualitative, not quantitative. Expositions of economic reasoning often use two-dimensional graphs to illustrate...
Elephant Curve, also known as the Lakner-Milanovic graph or the global growth incidence curve, is a graph that illustrates the unequal distribution of income...
Pakistan. This opened up avenues for new job opportunities and thus the economicgraph of the country started rising. He oversaw the development and completion...
ideological positions of voters are displayed in the form of a graph and if that graph shows a single peak, then a median voter can be identified and...
Her vision at LinkedIn is to create economic opportunities for the global workforce. She uses LinkedIn EconomicGraph, a digital representation of the global...
tree is a subset of the edges of a connected, edge-weighted undirected graph that connects all the vertices together, without any cycles and with the...
economists often use two-dimensional graphs instead of functions. Qualitative models – although almost all economic models involve some form of mathematical...
The Great Depression (1929–1939) was a severe global economic downturn that affected many countries across the world. It became evident after a sharp decline...
A scatter plot, also called a scatterplot, scatter graph, scatter chart, scattergram, or scatter diagram, is a type of plot or mathematical diagram using...
signals in the time domain. A time-domain graph shows how a signal changes with time, whereas a frequency-domain graph shows how much of the signal lies within...
mathematics, and in particular the study of game theory, a function is graph continuous if it exhibits the following properties. The concept was originally...
The resulting political unity and military security allowed for a common economic system and enhanced trade and commerce, with increased agricultural productivity...
In mainstream economics, economic surplus, also known as total welfare or total social welfare or Marshallian surplus (after Alfred Marshall), is either...
Abenomics (アベノミクス, 安倍ノミクス, Abenomikusu) refers to the economic policies implemented by the Government of Japan led by the Liberal Democratic Party (LDP)...
each unit price of the good. Demand is often represented by a table or a graph showing price and quantity demanded (as in the figure). Demand theory describes...
In graph theory and network analysis, indicators of centrality assign numbers or rankings to nodes within a graph corresponding to their network position...
and economic freedom as measured by The Wall Street Journal/Heritage Foundation survey." In his 2005 book The End of Poverty, Jeffrey Sachs graphed countries'...
add value to the firm. Open innovation competitions, like LinkedIn’s EconomicGraph Challenge, allow for open and broader use of data by many independent...
 Global Information