Global Information Lookup Global Information

List of countries by greenhouse gas emissions per capita information


Per capita annual GHG emissions, including agriculture and land use change, measured in carbon dioxide-equivalents over a 100-year timescale.[1]
Worldwide CO2 Emissions in 2021, by region, per capita, growth. Visualization in a variwide diagram.
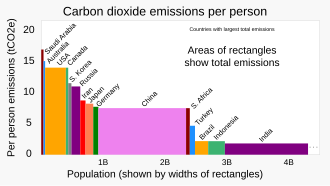
Carbon dioxide emissions per capita for the largest emitting countries[2]
Global map of greenhouse gas (GHG) emissions. Greenhouse gas emissions, including agriculture and land use change, measured in carbon dioxide-equivalents over a 100-year timescale.[3]

This is a list of sovereign states and territories by per capita greenhouse gas emissions due to certain forms of human activity, based on the EDGAR database created by European Commission. The following table lists the 1970, 1990, 2005, 2017 and 2022 annual per capita GHG[n 1] emissions estimates (in metric tons of CO2 equivalent per year). The data include carbon dioxide (CO2), methane (CH4) and nitrous oxide (N2O) from all sources, including agriculture and land use change. They are measured in carbon dioxide-equivalents over a 100-year timescale.[n 2]

The Intergovernmental Panel on Climate Change (IPCC) 6th assessment report finds that the “Agriculture, Forestry and Other Land Use (AFOLU)” sector on average, accounted for 13-21% of global total anthropogenic GHG emissions in the period 2010-2019.[4] Land use change drivers net AFOLU CO2 emission fluxes, with deforestation being responsible for 45% of total AFOLU emissions. In addition to being a net carbon sink and source of GHG emissions, land plays an important role in climate through albedo effects, evapotranspiration, and aerosol loading through emissions of volatile organic compounds.[4] The IPCC report finds that the LULUCF sector offers significant near-term mitigation potential while providing food, wood and other renewable resources as well as biodiversity conservation. Mitigation measures in forests and other natural ecosystems provide the largest share of the LULUCF mitigation potential between 2020 and 2050. Among various LULUCF activities, reducing deforestation has the largest potential to reduce anthropogenic GHG emissions, followed by carbon sequestration in agriculture and ecosystem restoration including afforestation and reforestation.[4] Land use change emissions can be negative.[n 3][6]

According to Science for Policy report in 2023 by the Joint Research Centre (JRC - the European Commission’s science and knowledge service) and International Energy Agency (IEA), global per-capita emissions in 2022 increased by 0.4% to reach 6.76 tCO2eq/cap, a value still 0.8% lower than in 2019, but have increased by about 8.3% from 6.24 tCO2eq/cap to 6.76 tCO2eq/cap between 1990 and 2022.[7]

The main advantage of measuring total national emissions per capita is that it does take population size into account. China has the largest CO2 and GHG emissions in the world, but also the largest population. For a fair comparison, emissions should be analyzed in terms of the amount of CO2 and GHG per capita.[8]

In 2022, China's GHG per capita emissions levels (10.95) are almost 60 percent those of the United States (17.90) and less than a sixth of those of Qatar (67.38 - the country with the highest emissions of GHG per capita in 2022).[9][7]

Measures of territorial-based emissions, also known as production-based emissions, do not account for emissions embedded in global trade, where emissions may be imported or exported in the form of traded goods, as it only reports emissions emitted within geographical boundaries. Accordingly, a proportion of the CO2 produced and reported in Asia and Africa is for the production of goods consumed in Europe and North America.[10]

According to the review of the scientific literature conducted by the Intergovernmental Panel on Climate Change (IPCC), carbon dioxide is the most important anthropogenic greenhouse gas by warming contribution.[11] Greenhouse gases (GHG) – primarily carbon dioxide but also others, including methane and chlorofluorocarbons – trap heat in the atmosphere, leading to global warming. Higher temperatures then act on the climate, with varying effects. For example, dry regions might become drier while, at the poles, the ice caps are melting, causing higher sea levels. In 2016, the global average temperature was already 1.1 °C above pre-industrial levels.[12]

  1. ^ a b "Total greenhouse gas emissions per capita". ourworldindata.org. Our World in Data. Retrieved 2023-11-01.
  2. ^ "Territorial (MtCO2)". GlobalCarbonAtlas.org. Retrieved 30 December 2021. (choose "Chart view"; use download link)
    ● Data for 2020 is also presented in Popovich, Nadja; Plumer, Brad (November 12, 2021). "Who Has The Most Historical Responsibility for Climate Change?". The New York Times. Archived from the original on December 29, 2021.
    ● Source for country populations: "List of the populations of the world's countries, dependencies, and territories". britannica.com. Encyclopedia Britannica.
  3. ^ "Greenhouse gas emissions". ourworldindata.org. Our World in Data. Retrieved 2023-11-01.
  4. ^ a b c d United Nations Framework Convention on Climate Change. "Land Use, Land-Use Change and Forestry (LULUCF)". unfccc.int. Retrieved 2023-11-01.
  5. ^ Global Carbon Project (2022) Supplemental data of Global Carbon Budget 2022 (Version 1.0) [Data set]. Global Carbon Project. https://doi.org/10.18160/gcp-2022
  6. ^ "Per capita greenhouse gas emissions". Our World in Data. Retrieved 2023-11-01.
  7. ^ a b Joint Research Centre (2023). "GHG emissions of all world countries". EDGAR - Emissions Database for Global Atmospheric Research. Retrieved 2023-11-01.
  8. ^ Roser, Max; Ritchie, Hannah (11 May 2017). "CO2 and other Greenhouse Gas Emissions". Our World in Data. Archived from the original on 4 July 2019.
  9. ^ Ritchie, Hannah; Roser, Max. "Per capita CO2 emissions". Our World in Data. Retrieved 2023-11-01.
  10. ^ Ritchie, Hannah; Roser, Max. "Consumption-based (trade-adjusted) emissions". Our World in Data. Retrieved 2023-11-01.
  11. ^ Intergovernmental Panel on Climate Change (2021). Climate Change 2021 The Physical Science Basis | Summary for Policymakers (PDF). p. 40. ISBN 978-92-9169-158-6.
  12. ^ Klugman, Cornelia. "The EU, a world leader in fighting climate change". European Parliament Think Tank. Retrieved 2023-11-01.


Cite error: There are <ref group=n> tags on this page, but the references will not show without a {{reflist|group=n}} template (see the help page).

and 28 Related for: List of countries by greenhouse gas emissions per capita information

Request time (Page generated in 1.1503 seconds.)

List of countries by greenhouse gas emissions per capita

Last Update:

This is a list of sovereign states and territories by per capita greenhouse gas emissions due to certain forms of human activity, based on the EDGAR database...

Word Count : 1361

List of countries by carbon dioxide emissions per capita

Last Update:

This is a list of sovereign states and territories by per capita carbon dioxide emissions due to certain forms of human activity, based on the EDGAR database...

Word Count : 1993

List of countries by greenhouse gas emissions

Last Update:

list of sovereign states and territories by greenhouse gas emissions due to certain forms of human activity, based on the EDGAR database created by European...

Word Count : 1282

Greenhouse gas emissions

Last Update:

States has higher emissions per capita. The main producers fueling the emissions globally are large oil and gas companies. Emissions from human activities...

Word Count : 16222

List of countries by carbon dioxide emissions

Last Update:

emissions, by country/region Historical greenhouse gas emissions 1990-2018 from Climate Watch CO₂ emissions per capita, 2016 Annual CO₂ emissions in 2017,...

Word Count : 1611

Greenhouse gas emissions by the United States

Last Update:

metric tons of carbon dioxide equivalent greenhouse gas (GHG) emissions in 2020, the second largest in the world after greenhouse gas emissions by China and...

Word Count : 6166

Greenhouse gas emissions by Russia

Last Update:

4% of world emissions. Annual carbon dioxide emissions alone are about 12 tons per person, more than double the world average. Cutting greenhouse gas emissions...

Word Count : 1454

Greenhouse gas emissions by Australia

Last Update:

representing per capita CO2e emissions of 21 tons, three times the global average. Coal was responsible for 30% of emissions. The national Greenhouse Gas Inventory...

Word Count : 8660

Greenhouse gas emissions by China

Last Update:

China's greenhouse gas emissions are the largest of any country in the world both in production and consumption terms, and stem mainly from coal burning...

Word Count : 5866

Greenhouse gas inventory

Last Update:

Greenhouse gas inventories are emission inventories of greenhouse gas emissions that are developed for a variety of reasons. Scientists use inventories...

Word Count : 4340

Greenhouse gas emissions by Turkey

Last Update:

a third of Turkey's six hundred million tonnes of annual greenhouse gas emissions, which are mostly carbon dioxide and part of the cause of climate change...

Word Count : 16826

Emission intensity

Last Update:

process; for example grams of carbon dioxide released per megajoule of energy produced, or the ratio of greenhouse gas emissions produced to gross domestic...

Word Count : 3005

Lists of sovereign states and dependent territories

Last Update:

greenhouse gas emissions per capita List of countries by natural disaster risk Lists of ecoregions by country List of environmental laws by country List...

Word Count : 5287

Carbon footprint

Last Update:

indirect emissions that it causes. The Greenhouse Gas Protocol (for carbon accounting of organizations) calls these Scope 1, 2 and 3 emissions. There are...

Word Count : 7890

List of countries by renewable electricity production

Last Update:

greenhouse gas emissions per person List of countries by total primary energy consumption and production Top contributors to greenhouse gas emissions...

Word Count : 266

Climate change in Canada

Last Update:

G20 countries, Canada was second only to Saudi Arabia for greenhouse gas emissions per capita. In 2018, Canada emitted a total of 729 million tons of carbon...

Word Count : 10211

Climate change in New Zealand

Last Update:

that New Zealand's gross emissions were 0.17% of the world's total gross greenhouse gas emissions. However, on a per capita basis, New Zealand is a significant...

Word Count : 16751

Climate change in Italy

Last Update:

also provides the emissions for 2019: 302.8 MtCO2, down 4.5% compared to 2018h 1; per capita: 5.02 tCO2. Energy-related CO2 emissions in Italy experienced...

Word Count : 5799

Climate change in Sweden

Last Update:

t/capita. In 2000, Sweden ranked in place 76 out of 185 countries for the per capita greenhouse gas emissions when taking any land use changes into account...

Word Count : 4984

Index of climate change articles

Last Update:

Glossary of climate change Scientific opinion on climate change List of countries by greenhouse gas emissions per capita List of countries by carbon dioxide...

Word Count : 907

Energy in Norway

Last Update:

one of the leading countries in the electrification of its transport sector, with the largest fleet of electric vehicles per capita in the world (see plug-in...

Word Count : 3535

Climate change

Last Update:

reducing their emissions, since developed countries contributed most to the accumulation of greenhouse gases in the atmosphere. Per-capita emissions were also...

Word Count : 28001

Climate change in India

Last Update:

fourth among the list of countries most affected by climate change in 2015. India emits about 3 gigatonnes (Gt) CO2eq of greenhouse gases each year; about...

Word Count : 5615

Climate change mitigation

Last Update:

action to limit the greenhouse gases in the atmosphere that cause climate change. Greenhouse gas emissions are primarily caused by people burning fossil...

Word Count : 23684

World energy supply and consumption

Last Update:

electricity production List of countries by energy consumption per capita List of countries by greenhouse gas emissions List of countries by renewable electricity...

Word Count : 3562

Energy transition

Last Update:

responsible for most human-caused greenhouse gas emissions. To meet the goals of the 2015 Paris Agreement on climate change, emissions must be reduced as soon as...

Word Count : 10558

Air pollution in India

Last Update:

is a major source of smoke, smog and particulate pollution. India has a low per capita emissions of greenhouse gases but the country as a whole is the...

Word Count : 4832

Environmental impacts of animal agriculture

Last Update:

variety of effects on the environment to some extent. Animal agriculture, in particular meat production, can cause pollution, greenhouse gas emissions, biodiversity...

Word Count : 13850

PDF Search Engine © AllGlobal.net