This article's factual accuracy may be compromised due to out-of-date information. The reason given is: A 2023 national inventory provides updated and more accurate information. Additionally Climate Action Tracker now rates Australia as "Insufficient" not "Highly Insufficient". Significant update is required.. Please help update this article to reflect recent events or newly available information.(February 2024)
Release of gases from Australia which contribute to global warming
This article is about gases from Australia which contribute to global warming, and their mitigation. For a full overview of climate change issues in the country, see Climate change in Australia.
Australian Greenhouse Gas Emissions by Source Sector (Sept. 2023)[1]
Electricity (28.3%)
Stationary energy (19.5%)
Transport (18.5%)
Fugitive emissions (9.0%)
Industrial processes (6.3%)
Agriculture (15.6%)
Waste (2.6%)
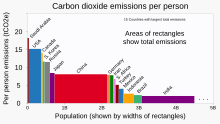
Emissions of carbon dioxide, a greenhouse gas, per capita by country.
Greenhouse gas emissions by Australia totalled 533 million tonnes CO2-equivalent based on greenhouse gas national inventory report data for 2019; representing per capita CO2e emissions of 21 tons,[2] three times the global average. Coal was responsible for 30% of emissions. The national Greenhouse Gas Inventory estimates for the year to March 2021 were 494.2 million tonnes, which is 27.8 million tonnes, or 5.3%, lower than the previous year. It is 20.8% lower than in 2005 (the baseline year for the Paris Agreement). According to the government, the result reflects the decrease in transport emissions due to COVID-19 pandemic restrictions, reduced fugitive emissions, and reductions in emissions from electricity; however, there were increased greenhouse gas emissions from the land and agriculture sectors.[3]
Australia uses principally coal power for electricity, accounting for 66% of grid-connected electricity generation in 2020,[4] but this is rapidly decreasing with a growing share of renewables making up the energy supply mix, and most existing coal-fired power station scheduled to cease operation between 2022 and 2048.[5] Emissions by the country have started to fall and are expected to continue to fall in coming years as more renewable projects come online.[6]
Climate Action Tracker rates Australia's overall commitment to emissions reduction as "highly insufficient". Policies and action as well as the domestic target are both "insufficient", fair share target is "highly insufficient", and climate finance is "critically insufficient". This is because the Australian government has continued to invest in natural gas projects, refused to increase its 2030 domestic emissions target, and is not on track to meet its current target.[7]
Climate change in Australia is caused by greenhouse gas emissions, and the country is generally becoming hotter, and more prone to extreme heat, bushfires, droughts, floods and longer fire seasons because of climate change.[8]
^"Australia: yearly greenhouse gas emissions by source 2023". Statista. Retrieved 27 April 2024.
^"Australia. 2019 National Inventory Report (NIR)". United Nations Climate Change. Australia. 24 May 2019. Archived from the original on 16 August 2021. Retrieved 24 April 2021.
^Department of Industry, Science (31 August 2021). "Australia's greenhouse gas emissions: March 2021 quarterly update". Department of Industry, Science, Energy and Resources. Archived from the original on 10 October 2021. Retrieved 9 October 2021.
^Dylan McConnell; Simon Holmes à Court; Steven Tan; Nik Cubrilovic. "An Open Platform for National Electricity Market Data". OpenNEM. Archived from the original on 6 November 2021. Retrieved 24 April 2021.
^"2020 Transmission Annual Planning Report" (PDF). TransGrid. June 2020. Archived (PDF) from the original on 14 August 2021. Retrieved 24 April 2021.
^"Australia's emissions to start falling thanks to renewables boom, researchers say". The Guardian. 23 October 2019. Archived from the original on 13 August 2021. Retrieved 3 March 2020.
^"Australia". climateactiontracker.org. Archived from the original on 19 November 2021. Retrieved 9 October 2021.
^"Climate change in Australia". CSIRO. 24 December 2020. Archived from the original on 30 October 2021. Retrieved 24 April 2021.
and 28 Related for: Greenhouse gas emissions by Australia information
GreenhousegasemissionsbyAustralia totalled 533 million tonnes CO2-equivalent based on greenhousegas national inventory report data for 2019; representing...
by about 50% over pre-industrial levels. The growing levels of emissions have varied, but have been consistent among all greenhousegases. Emissions in...
states and territories bygreenhousegasemissions due to certain forms of human activity, based on the EDGAR database created by European Commission. The...
and territories by per capita greenhousegasemissions due to certain forms of human activity, based on the EDGAR database created by European Commission...
Greenhousegas inventories are emission inventories of greenhousegasemissions that are developed for a variety of reasons. Scientists use inventories...
than a third of Turkey's six hundred million tonnes of annual greenhousegasemissions, which are mostly carbon dioxide and part of the cause of climate...
countries) Total CO2 emissions for the period 1970 to 2017 and 2017 emissions, by country/region Historical greenhousegasemissions 1990-2018 from Climate...
demonstrations in Australia's history. GreenhousegasemissionsbyAustralia totalled 533 million tonnes CO2-equivalent based on greenhousegas national inventory...
Greenhousegasemissions from wetlands of concern consist primarily of methane and nitrous oxide emissions. Wetlands are the largest natural source of...
the GreenhouseGas Protocol and ISO 14064. These usually group the emissions into three categories. The Scope 1 category includes the direct emissions from...
direct and indirect measurement of greenhousegasemissions. Indirect methods calculate emissions of greenhousegases based on related metrics such as fossil...
aimed to reduce greenhousegasemissions in Australiaby 5% below 2000 levels by 2020 and 80% below 2000 levels by 2050. Although Australia does not levy...
indirect emissions that it causes. The GreenhouseGas Protocol (for carbon accounting of organizations) calls these Scope 1, 2 and 3 emissions. There are...
net warming, as the warming impact of greenhousegasemissions was offset by cooling from sulfur dioxide emissions. Sulfur dioxide causes acid rain, but...
(GWP) is an index to measure how much infrared thermal radiation a greenhousegas would absorb over a given time frame after it has been added to the...
2005 and is intended to lower greenhousegasemissionsby the European Union countries. Cap and trade schemes limit emissions of specified pollutants over...
those from coal, usually about half the greenhousegasemissions of coal; the noted exception was a 2011 study by Robert W. Howarth and others of Cornell...
compensate for (i.e. “offset”) their greenhousegasemissionsby investing in projects that reduce, avoid, or remove emissions elsewhere. When an entity invests...
Increasing methane emissions are a major contributor to the rising concentration of greenhousegases in Earth's atmosphere, and are responsible for up...
fossil fuels. Indirect CO2 emissions from land use change, and the emissions of methane, nitrous oxide and other greenhousegases play major supporting roles...
development of emissions. This can be addressed with the dynamic price model of emissions trading. An emissions trading scheme for greenhousegasemissions (GHGs)...
and trade (CAT) or emissions trading scheme (ETS). One prominent example is carbon emission trading for CO2 and other greenhousegases which is a tool for...
documents greenhousegas (GHG) emissions between 1990 and 2014 for the EU-28 individual member states by IPCC sector. Total greenhousegasemissions fell by 24%...
of Australia's total greenhousegasemissions. In 2018 Australia was the 8th highest emitter of greenhousegases per capita in the world. Australia's energy...
amendments made by the Australian Parliament in 2014 and 2015, the Authority was required to review Australia'sgreenhousegasemissions caps, any indicative...
have also influenced EU emissions standards.[citation needed] California is attempting to regulate greenhousegasemissions from automobiles, but faces...
 Global Information