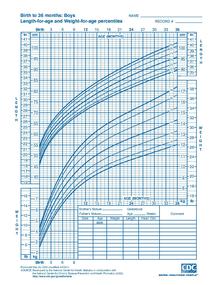
Sample growth chart for use with American boys from birth to age 36 months.
A growth chart is used by pediatricians and other health care providers to follow a child's growth over time. Growth charts have been constructed by observing the growth of large numbers of healthy children over time. The height, weight, and head circumference of a child can be compared to the expected parameters of children of the same age and sex to determine whether the child is growing appropriately. Growth charts can also be used to predict the expected adult height and weight of a child because, in general, children maintain a fairly constant growth curve. When a child deviates from his or her previously established growth curve, investigation into the cause is generally warranted. Parameters used to analyze growth charts include weight velocity (defined as rate of change in weight over time), height velocity (defined as rate of change in stature over time), and whether someone's growth chart crosses percentiles. For instance, endocrine disorders can be associated with a decrease in height velocity and preserved weight velocity while normal growth variants are associated with a decrease in height and weight velocity that are proportional to each other. It's important to note that other parameters are more commonly used such as waist circumference for assessing obesity and skin fold difference for assessing malnutrition. Growth charts can also be compiled with a portion of the population deemed to have been raised in more or less ideal environments, such as nutrition that conforms to pediatric guidelines, and no maternal smoking. Charts from these sources end up with slightly taller but thinner averages.[1]
Growth curve of a girl, compared to the 2006 WHO curves
Growth charts are different for persons assigned male at birth and female at birth, due in part to pubertal differences and disparity in final adult height. In addition, children born prematurely and children with chromosomal abnormalities such as Down syndrome and Turner syndrome follow distinct growth curves which deviate significantly from children without these conditions. As such, growth charts have been created to describe the expected growth patterns of several developmental conditions. Since there are differences in normal growth rates between breastfed and formula-fed babies,[2] the World Health Organization growth charts, which better reflect the growth pattern of the healthy, breastfed infant, are considered the standard for U.S. children under age two.[3]
^"WHO Child Growth Standards" (PDF). World Health Organization.
^Dewey, KG; Peerson, JM; Brown, KH; Krebs, NF; Michaelsen, KF; Persson, LA; Salmenpera, L; Whitehead, RG; Yeung, DL (1995). "Growth of breast-fed infants deviates from current reference data: A pooled analysis of US, Canadian, and European data sets. World Health Organization Working Group on Infant Growth". Pediatrics. 96 (3 Pt 1): 495–503. doi:10.1542/peds.96.3.497. PMID 7651784. S2CID 20425748.
^"Use of World Health Organization and CDC Growth Charts for Children Aged 0–59 Months in the United States" (PDF). Centers for Disease Control.
A growthchart is used by pediatricians and other health care providers to follow a child's growth over time. Growthcharts have been constructed by observing...
one or more weight centile spaces on a World Health Organization (WHO) growthchart depending on birth weight or when weight is below the 2nd percentile...
characteristic of dwarfism is an adult height less than 2.3% of the CDC standard growthcharts. There is a wide range of physical characteristics. Variations in individuals...
background information about their pregnancy, such as their medical history, growthcharts and any scan reports. If the mother goes to a different hospital for...
Percentile growthcharts, such as the figures created by the Centers for Disease Control and Prevention (CDC) shown on this page, are used to track growth by...
auxology. Growth has long been recognized as a measure of the health of individuals, hence part of the reasoning for the use of growthcharts. For individuals...
be included in this section. Growthchart and developmental history For children and teenagers, charts documenting growth as it compares to other children...
thus population growth. The 2022 projections from the United Nations Population Division (chart #1) show that annual world population growth peaked at 2.3%...
thus population growth. The 2022 projections from the United Nations Population Division (chart #1) show that annual world population growth peaked at 2.3%...
Poids et Mesures. 2014. Retrieved 5 July 2015. "Using the BMI-for-Age GrowthCharts". cdc.gov. Centers for Disease Control. Archived from the original on...
"Protomartyr – Formal Growth in the Desert review". DIY. Retrieved May 15, 2024. "Official Scottish Albums Chart Top 100". Official Charts Company. Retrieved...
The UK Singles Chart (currently titled the Official Singles Chart, with the upper section more commonly known as the Official UK Top 40) is compiled by...
10th percentile of standardized growthcharts appropriate to the population. Prenatal or postnatal presentation of growth deficits can occur, but are most...
January 3, 2010.{{cite web}}: CS1 maint: unfit URL (link) DALnet History - GrowthChart "DALnetizen - The Current Situation". Archived from the original on July...
quantile regression is in the areas of growthcharts, where percentile curves are commonly used to screen for abnormal growth. The idea of estimating a median...
2012. Jureša, Vesna; Musil, Vera & Kujundžić Tiljak, Mirjana (2012). "Growthcharts for Croatian school children and secular trends in past twenty years"...
launched following the growth of the sector in the UK for the seventh year in a row. In July 2015, Official Charts changed its chart methodology from traditional...
population is projected to increase by 70%. This compares with the 32% growth of world population during the same period. According to a study published...
evolution equation. In the aftermath of World War II, the study of wave growth garnered significant attention. The global nature of the war, encompassing...
updates from organisations such as the World Health Organization for growthchart updates The Scottish National Personal Child Health Record is available...
Weight and height percentiles are determined by growthcharts and body mass index charts to compare a child's measurements with those of other children...
are needed. Measured values from ultrasonography are compared with the growthchart to estimate fetal weight. Crown-rump length can be used as the best ultrasonographic...
showed better nutrition status, higher scores on a height to weight growthchart, and better school enrolment rates compared to children who are equally...
010. PMID 29422204. S2CID 46810955. "What is the average baby length? Growthchart by month". www.medicalnewstoday.com. 18 March 2019. Archived from the...
endorsed by Club for Growth in 2010, 20 won election. The following chart lists candidates endorsed by the Club: In 2012, the Club for Growth PAC endorsed eighteen...
needed] The author of the test, William K. Frankenburg, likened it to a growthchart of height and weight and encouraged users to consider factors other than...
 Global Information