Process control tool to determine if a manufacturing process is in a state of control
This article includes a list of general references, but it lacks sufficient corresponding inline citations. Please help to improve this article by introducing more precise citations.(December 2013) (Learn how and when to remove this message)
Control chart
One of the Seven basic tools of quality
First described by
Walter A. Shewhart
Purpose
To determine whether a process should undergo a formal examination for quality-related problems
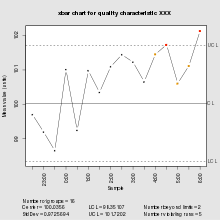
Control charts are graphical plots used in production control to determine whether quality and manufacturing processes are being controlled under stable conditions. (ISO 7870-1)[1]
The hourly status is arranged on the graph, and the occurrence of abnormalities is judged based on the presence of data that differs from the conventional trend or deviates from the control limit line.
Control charts are classified into Shewhart individuals control chart (ISO 7870-2)[2] and CUSUM(CUsUM)(or cumulative sum control chart)(ISO 7870-4).[3]
Control charts, also known as Shewhart charts (after Walter A. Shewhart) or process-behavior charts, are a statistical process control tool used to determine if a manufacturing or business process is in a state of control. It is more appropriate to say that the control charts are the graphical device for Statistical Process Monitoring (SPM). Traditional control charts are mostly designed to monitor process parameters when the underlying form of the process distributions are known. However, more advanced techniques are available in the 21st century where incoming data streaming can-be monitored even without any knowledge of the underlying process distributions. Distribution-free control charts are becoming increasingly popular[citation needed].
^"Control charts — Part 1: General guidelines". iso.org. Retrieved 2022-12-11.
^"Control charts — Part 2: Shewhart control charts". iso.org. Retrieved 2022-12-11.
^"Control charts — Part 4: Cumulative sum charts". iso.org. Retrieved 2022-12-11.
Controlcharts are graphical plots used in production control to determine whether quality and manufacturing processes are being controlled under stable...
some of them: Controlchart Greninger chart Heatmap Natal chart Nomogram Pareto chart Run chart Strip chart Structure chart Vowel chart One more example:...
lawsuit in March 2014 by Media Control AG, Media Control® GfK International had to change its name. Dissemination of the charts is conducted by various media...
In statistical quality control, the individual/moving-range chart is a type of controlchart used to monitor variables data from a business or industrial...
purpose of the Pareto chart is to highlight the most important among a (typically large) set of factors. In quality control, Pareto charts are useful to find...
management. A controlchart is a more specific kind of run chart. The controlchart is one of the seven basic tools of quality control, which also include...
specifications) output can be measured. Key tools used in SPC include run charts, controlcharts, a focus on continuous improvement, and the design of experiments...
A bar chart or bar graph is a chart or graph that presents categorical data with rectangular bars with heights or lengths proportional to the values that...
In statistical quality control, the regression controlchart allows for monitoring a change in a process where two or more variables are correlated. The...
pie chart (or a circle chart) is a circular statistical graphic which is divided into slices to illustrate numerical proportion. In a pie chart, the...
In statistical quality control, the EWMA chart (or exponentially weighted moving average chart) is a type of controlchart used to monitor either variables...
as "cross-functional" when the chart is divided into different vertical or horizontal parts, to describe the control of different organizational units...
chart is also known as web chart, spider chart, spider graph, spider web chart, star chart, star plot, cobweb chart, irregular polygon, polar chart,...
Quality control (QC) is a process by which entities review the quality of all factors involved in production. ISO 9000 defines quality control as "a part...
decreases. Run charts are similar in some regards to the controlcharts used in statistical process control, but do not show the control limits of the...
In statistical quality control, the CUSUM (or cumulative sum controlchart) is a sequential analysis technique developed by E. S. Page of the University...
A scientific control is an experiment or observation designed to minimize the effects of variables other than the independent variable (i.e. confounding...
project, and gain approval to release resources. A controlchart can be useful during the Control stage to assess the stability of the improvements over...
introduced by Mary Eleanor Spear in her book "Charting Statistics" in 1952 and again in her book "Practical Charting Techniques" in 1969. The box-and-whisker...
A record chart, in the music industry, also called a music chart, is a ranking of recorded music according to certain criteria during a given period....
 Global Information