For other uses, see Chart (disambiguation), Graph (disambiguation), and Diagram.
This article needs additional citations for verification. Please help improve this article by adding citations to reliable sources. Unsourced material may be challenged and removed. Find sources: "Chart" – news · newspapers · books · scholar · JSTOR(October 2011) (Learn how and when to remove this message)
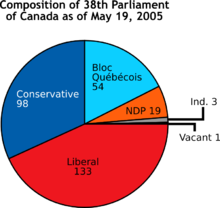
A pie chart showing the composition of the 38th Parliament of Canada.
A chart (sometimes known as a graph) is a graphical representation for data visualization, in which "the data is represented by symbols, such as bars in a bar chart, lines in a line chart, or slices in a pie chart".[1] A chart can represent tabular numeric data, functions or some kinds of quality structure and provides different info.
The term "chart" as a graphical representation of data has multiple meanings:
A data chart is a type of diagram or graph, that organizes and represents a set of numerical or qualitative data.
Maps that are adorned with extra information (map surround) for a specific purpose are often known as charts, such as a nautical chart or aeronautical chart, typically spread over several map sheets.
Other domain-specific constructs are sometimes called charts, such as the chord chart in music notation or a record chart for album popularity.
Charts are often used to ease understanding of large quantities of data and the relationships between parts of the data. Charts can usually be read more quickly than the raw data. They are used in a wide variety of fields, and can be created by hand (often on graph paper) or by computer using a charting application. Certain types of charts are more useful for presenting a given data set than others. For example, data that presents percentages in different groups (such as "satisfied, not satisfied, unsure") are often displayed in a pie chart, but maybe more easily understood when presented in a horizontal bar chart.[2] On the other hand, data that represents numbers that change over a period of time (such as "annual revenue from 1990 to 2000") might be best shown as a line chart.
^Cary Jensen, Loy Anderson (1992). Harvard graphics 3: the complete reference. Osborne McGraw-Hill ISBN 0-07-881749-8 p.413
^Howard Wainer (1997) Visual revelations: graphical tales of fate and Deception from Napoleon Bonaparte to Ross Perot, Lawrence Erlbaum Associates, Inc. ISBN 0-8058-3878-3 p.87-90.
represented by symbols, such as bars in a bar chart, lines in a line chart, or slices in a pie chart". A chart can represent tabular numeric data, functions...
the music industry standard record chart in the United States for songs, published weekly by Billboard magazine. Chart rankings are based on sales (physical...
A record chart, in the music industry, also called a music chart, is a ranking of recorded music according to certain criteria during a given period....
The UK Singles Chart (currently titled the Official Singles Chart, with the upper section more commonly known as the Official UK Top 40) is compiled by...
The Billboard 200 is a record chart ranking the 200 most popular music albums and EPs in the United States. It is published weekly by Billboard magazine...
A Gantt chart is a bar chart that illustrates a project schedule. It was designed and popularized by Henry Gantt around the years 1910–1915. Modern Gantt...
A Snellen chart is an eye chart that can be used to measure visual acuity. Snellen charts are named after the Dutch ophthalmologist Herman Snellen who...
A bar chart or bar graph is a chart or graph that presents categorical data with rectangular bars with heights or lengths proportional to the values that...
The ARIA Charts are the main Australian music sales charts, issued weekly by the Australian Recording Industry Association. The charts are a record of...
Chartism was a working-class movement for political reform in the United Kingdom that erupted from 1838 to 1857 and was strongest in 1839, 1842 and 1848...
bidental fricative [h̪͆] IPA vowel chart with audio IPA consonant chart with audio International Phonetic Alphabet chart for English dialects Extensions...
The Circle Chart (Korean: 써클차트; RR: Sseokeul-chateu), previously known as the Gaon Music Chart or the Gaon Chart (Korean: 가온차트; RR: Gaon-chateu), tabulates...
music sales charts. The charts are a record of the highest-selling singles and albums in various genres in Switzerland. The Swiss charts include: Singles...
A Pareto chart is a type of chart that contains both bars and a line graph, where individual values are represented in descending order by bars, and the...
The Official Albums Chart, previously the UK Albums Chart, is a list of albums ranked by sales and audio streaming in the United Kingdom. It was published...
The Official Charts Company (OCC or Official Charts; previously known as the Chart Information Network, CIN, and the Official UK Charts Company; legally...
Look up charting in Wiktionary, the free dictionary. Charting may refer to: Chart, graphical representation of data Nautical chart, process of building...
Dutch Charts, GfK Dutch Charts, MegaCharts is a chart company responsible for producing a number of official charts in the Netherlands, of which the Single...
extension of the Billboard charts, provides additional weekly charts, as well as year-end charts. The two most important charts are the Billboard Hot 100...
pie chart (or a circle chart) is a circular statistical graphic which is divided into slices to illustrate numerical proportion. In a pie chart, the...
The Smith chart (sometimes also called Smith diagram, Mizuhashi chart (水橋チャート), Mizuhashi–Smith chart (水橋スミスチャート), Volpert–Smith chart (Диаграмма Вольперта—Смита)...
An eye chart is a chart used to measure visual acuity comprising lines of optotypes in ranges of sizes. Optotypes are the letters or symbols shown on an...
The GfK Entertainment charts are the official charts for music, home video, and video games in Germany and are gathered and published by GfK Entertainment...
A run chart, also known as a run-sequence plot is a graph that displays observed data in a time sequence. Often, the data displayed represent some aspect...
A nautical chart or hydrographic chart is a graphic representation of a sea region or water body and adjacent coasts or banks. Depending on the scale...
A burndown chart or burn down chart is a graphical representation of work left to do versus time. The outstanding work (or backlog) is often on the vertical...
chart or color reference card is a flat, physical object that has many different color samples present. They can be available as a single-page chart,...
retroflex consonants (see above), but denotes rhoticity after vowel symbols. SAMPA chart for English X-SAMPA SAMPA computer readable phonetic alphabet...
 Global Information