"Surface analysis" redirects here. For other uses, see surface science and etymology.
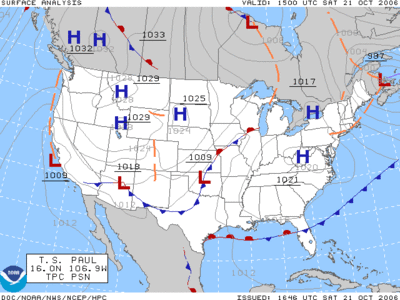
A surface weather analysis for the United States on October 21, 2006. By that time, Tropical Storm Paul was active (Paul later became a hurricane).
Surface weather analysis is a special type of weather map that provides a view of weather elements over a geographical area at a specified time based on information from ground-based weather stations.[1]
Weather maps are created by plotting or tracing the values of relevant quantities such as sea level pressure, temperature, and cloud cover onto a geographical map to help find synoptic scale features such as weather fronts.
The first weather maps in the 19th century were drawn well after the fact to help devise a theory on storm systems.[2] After the advent of the telegraph, simultaneous surface weather observations became possible for the first time, and beginning in the late 1840s, the Smithsonian Institution became the first organization to draw real-time surface analyses. Use of surface analyses began first in the United States, spreading worldwide during the 1870s. Use of the Norwegian cyclone model for frontal analysis began in the late 1910s across Europe, with its use finally spreading to the United States during World War II.
Surface weather analyses have special symbols that show frontal systems, cloud cover, precipitation, or other important information. For example, an H may represent high pressure, implying clear skies and relatively warm weather. An L, on the other hand, may represent low pressure, which frequently accompanies precipitation. Various symbols are used not just for frontal zones and other surface boundaries on weather maps, but also to depict the present weather at various locations on the weather map. Areas of precipitation help determine the frontal type and location.
^Air Apparent: How Meteorologists Learned to Map, Predict, and Dramatize Weather. University of Chicago PressChicago: 1999.
^Eric R. Miller. American Pioneers in Meteorology. Retrieved on 2007-04-18.
and 27 Related for: Surface weather analysis information
features within the wind pattern. A popular type of surfaceweather map is the surfaceweatheranalysis, which plots isobars to depict areas of high pressure...
than the ground below it. A surfaceweatheranalysis is a special type of weather map which provides a top view of weather elements over a geographical...
Surfaceweather observations are the fundamental data used for safety as well as climatological reasons to forecast weather and issue warnings worldwide...
short term changes in the weather. Many measurements of air pressure are used within surfaceweatheranalysis to help find surface troughs, pressure systems...
hydrostatic equilibrium equation. A surfaceweatheranalysis is a special type of weather map that provides a view of weather elements over a geographical area...
including ensembles. Coordination with the surfaceanalysis, model diagnostics, quantitative precipitation, winter weather, and tropical forecast desks is performed...
measured in Tonsontsengel, Mongolia on 19 December 2001. A surfaceweatheranalysis is a type of weather map that depicts positions for high- and low-pressure...
Automatic Weather Station Network Global Telecommunications System Lightning detection Surfaceweather observation and surfaceweatheranalysisWeather radar...
the surface, and is at the same position in both cases. Consequently, the location of the occluded front appearing in the surfaceweatheranalysis is often...
while the sun is shining. supercell subtropical cyclone surfaceweatheranalysissurfaceweather observation sustained wind synoptic scale meteorology tail...
kilometres (about 620 miles) or more Surfaceweatheranalysis – a special type of weather map that provides a view of weather elements over a geographical area...
behave further in the week. On February 21, 1971, a procedural surfaceweatheranalysis failed to indicate either a well-developed low-pressure area, or...
(see under "Significant events") supercell surface temperature inversion surfaceweatheranalysissurfaceweather observation synoptic scale meteorology teleconnection...
their warm core nature. Surface anticyclones form due to downward motion through the troposphere, the atmospheric layer where weather occurs. Preferred areas...
This is a list of weather records, a list of the most extreme occurrences of weather phenomena for various categories. Many weather records are measured...
"Observational Analysis of the 27 May 1997 Central Texas Tornadic Event. Part I: Prestorm Environment and Storm Maintenance/Propagation". Monthly Weather Review...
Narrow Cold Frontal Rainband. Air mass Blue Norther (weather) Cold wave SurfaceweatheranalysisWeather front Whiteman, C. David (2000). Mountain meteorology :...
Contours, 2013. NOAA's National Weather Service, Glossary. Edward J. Hopkins, Ph.D. (1996-06-10). "SurfaceWeatherAnalysis Chart". University of Wisconsin...
which is in the public domain. "September 21, 1934, SurfaceWeatherAnalysis" (PDF). United States Weather Bureau. National Oceanic and Atmospheric Administration...
the station model to show surfaceweather conditions, but the model can also show the weather aloft as reported by a weather balloon's radiosonde or a...
physical weathering will increase the surface area exposed to chemical action, thus amplifying the rate of disintegration. Frost weathering is the most...
sufficient, the cap can be broken, resulting in convective clouds. SurfaceweatheranalysisWeather front Outflow boundary Scott Girhard (2007-05-04). "Lecture...
 Global Information