 Global Information
List of cities in Botswana information
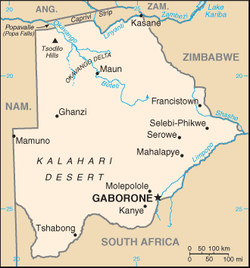


The following is a list of cities and towns or villages in Botswana with population of over 1,000 citizens in the year 2022.[1][2] Capitals of the administrative divisions (cities, towns or districts) are shown in boldface.
| Rank | Name | City, Town or District | Population 2011[1] | Population 2022[2] | Change |
|---|---|---|---|---|---|
| 1. | Gaborone | Gaborone | 231,592 | 246,325 | +6.36% |
| 2. | Francistown | Francistown | 98,961 | 103,417 | +4.50% |
| 3. | Mogoditshane | Kweneng District | 58,632 | 88,004 | +50.10% |
| 4. | Maun | North-West District | 65,693 | 85,350 | +29.92% |
| 5. | Molepolole | Kweneng District | 73,103 | 74,861 | +2.40% |
| 6. | Serowe | Central District | 57,588 | 55,676 | −3.32% |
| 7. | Tlokweng | South-East District | 37,364 | 55,508 | +48.56% |
| 8. | Palapye | Central District | 41,102 | 52,636 | +28.06% |
| 9. | Mochudi | Kgatleng District | 47,001 | 50,321 | +7.06% |
| 10. | Mahalapye | Central District | 46,418 | 48,431 | +4.34% |
| 11. | Kanye | Southern District | 52,214 | 48,028 | −8.02% |
| 12. | Selibe Phikwe | Selibe Phikwe | 49,411 | 42,488 | −14.01% |
| 13. | Letlhakane | Central District | 26,393 | 36,404 | +37.93% |
| 14. | Ramotswa | South-East District | 30,381 | 33,271 | +9.51% |
| 15. | Lobatse | Lobatse | 29,007 | 29,772 | +2.64% |
| 16. | Mmopane | Kweneng District | 17,845 | 25,460 | +42.67% |
| 17. | Thamaga | Kweneng District | 23,096 | 25,300 | +9.54% |
| 18. | Moshupa | Southern District | 24,231 | 23,858 | −1.54% |
| 19. | Tonota | Central District | 24,007 | 23,296 | −2.96% |
| 20. | Bobonong | Central District | 22,483 | 21,216 | −5.64% |
| 21. | Gabane | Kweneng District | 16,671 | 20,027 | +20.13% |
| 22. | Ghanzi | Ghanzi District | 16,276 | 19,012 | +16.81% |
| 23. | Jwaneng | Jwaneng | 18,008 | 18,784 | +4.31% |
| 24. | Tutume | Central District | 18,295 | 18,582 | +1.57% |
| 25. | Kopong | Kweneng District | 11,099 | 13,823 | +24.54% |
| 26. | Mmadinare | Central District | 15,177 | 13,198 | −13.04% |
| 27. | Tati Siding | North-East District | 8,197 | 12,404 | +51.32% |
| 28. | Tshabong | Kgalagadi District | 9,489 | 11,651 | +22.78% |
| 29. | Metsimotlhabe | Kweneng District | 9,270 | 11,617 | +25.32% |
| 30. | Gumare | North-West District | 8,970 | 11,572 | +29.01% |
| 31. | Shakawe | North-West District | 7,420 | 10,589 | +42.71% |
| 32. | Oodi | Kgatleng District | 5,874 | 10,257 | +74.62% |
| 33. | Bokaa | Kgatleng District | 6,462 | 9,146 | +41.54% |
| 34. | Kasane | Chobe District | 9,244 | 9,143 | −1.09% |
| 35. | Borolong | Central District | 5,269 | 8,917 | +69.24% |
| 36. | Shoshong | Central District | 11,884 | 8,887 | −25.22% |
| 37. | Molapowabojang | Southern District | 9,433 | 8,722 | −7.54% |
| 38. | Kazungula | Chobe District | 4,320 | 8,704 | +101.48% |
| 39. | Orapa | Orapa | 9,531 | 8,648 | −9.26% |
| 40. | Letlhakeng | Kweneng District | 9,871 | 8,343 | −15.48% |
| 41. | Nata | Central District | 7,732 | 7,779 | +0.61% |
| 42. | Rakops | Central District | 7,240 | 7,439 | +2.75% |
| 43. | Mmankgodi | Kweneng District | 7,459 | 7,396 | −0.84% |
| 44. | Lerala | Central District | 7,455 | 7,204 | −3.37% |
| 45. | Otse | South-East District | 7,976 | 6,986 | −12.41% |
| 46. | Kumakwane | Kweneng District | 5,901 | 6,826 | +15.68% |
| 47. | Sese | Southern District | 2,721 | 6,798 | +149.83% |
| 48. | Kang | Kgalagadi District | 6,570 | 6,764 | +2.95% |
| 49. | Lentsweletau | Kweneng District | 7,467 | 6,653 | −10.90% |
| 50. | Ramotswa station/Taung | South-East District | 4,250 | 6,286 | +47.91% |
| 51. | Masunga | North-East District | 5,666 | 6,216 | +9.71% |
| 52. | Lotlhakane | Southern District | 5,210 | 6,045 | +16.03% |
| 53. | Sefophe | Central District | 6,938 | 6,001 | −13.51% |
| 54. | Rasesa | Kgatleng District | 4,491 | 5,966 | +32.84% |
| 55. | Maitengwe | Central District | 6,216 | 5,929 | −4.62% |
| 56. | Mathangwane | Central District | 5,983 | 5,918 | −1.09% |
| 57. | Shashe-Mooke | Central District | 4,028 | 5,897 | +46.40% |
| 58. | Good Hope | Southern District | 6,377 | 5,672 | −11.06% |
| 59. | Gweta | Central District | 7,016 | 5,548 | −20.92% |
| 60. | Mmathethe | Southern District | 6,928 | 5,421 | −21.75% |
| 61. | Sefhare | Central District | 5,295 | 5,381 | +1.62% |
| 62. | Chadibe | Central District | 5,218 | 5,371 | +2.93% |
| 63. | Tsetsebjwe | Central District | 4,848 | 5,248 | +8.25% |
| 64. | Hukuntsi | Kgalagadi District | 4,751 | 5,224 | +9.96% |
| 65. | Charles Hill | Ghanzi District | 3,791 | 5,164 | +36.22% |
| 66. | Morwa | Kgatleng District | 3,566 | 4,988 | +39.88% |
| 67. | Mandunyane | Central District | 3,589 | 4,584 | +27.72% |
| 68. | Etsha 6 | North-West District | 3,130 | 4,570 | +46.01% |
| 69. | Digawana | Southern District | 3,296 | 4,356 | +32.16% |
| 70. | Mokatse | Kgatleng District | 0 | 4,321 | NA |
| 71. | Pitsane Siding | Southern District | 3,654 | 4,312 | +18.01% |
| 72. | Mopipi | Central District | 3,912 | 4,115 | +5.19% |
| 73. | Dukwi | Central District | 3,438 | 4,075 | +18.53% |
| 74. | Nkange | Central District | 3,550 | 4,006 | +12.85% |
| 75. | Matshelagabedi | North-East District | 2,871 | 3,987 | +38.87% |
| 76. | Ramokgonami | Central District | 4,486 | 3,932 | −12.35% |
| 77. | Sebina | Central District | 3,276 | 3,865 | +17.98% |
| 78. | Maunatlala | Central District | 4,552 | 3,862 | −15.16% |
| 79. | Shashe-Mooke | Central District | 3,136 | 3,805 | +21.33% |
| 80. | Manyana | Southern District | 3,550 | 3,752 | +5.69% |
| 81. | Chadibe | Central District | 2,973 | 3,678 | +23.71% |
| 82. | Modipane | Kgatleng District | 3,197 | 3,624 | +13.36% |
| 83. | Takatokwane | Kweneng District | 2,728 | 3,444 | +26.25% |
| 84. | Etsha 13 | North-West District | 2,377 | 3,401 | +43.08% |
| 85. | Lecheng | Central District | 3,344 | 3,352 | +0.24% |
| 86. | Werda | Kgalagadi District | 3,261 | 3,349 | +2.70% |
| 87. | Moiyabana | Central District | 3,571 | 3,264 | −8.60% |
| 88. | Gakuto | Kweneng District | 1,350 | 3,227 | +139.04% |
| 89. | Pilane | Kgatleng District | 1,795 | 3,222 | +79.50% |
| 90. | Ranaka | Southern District | 2,409 | 3,207 | +33.13% |
| 91. | Matebeleng | Kgatleng District | 2,196 | 3,198 | +45.63% |
| 92. | Radisele | Central District | 2,985 | 3,164 | +6.00% |
| 93. | Khudumelapye | Kweneng District | 2,080 | 3,135 | +50.72% |
| 94. | Khakhea | Southern District | 2,944 | 3,084 | +4.76% |
| 95. | Serule | Central District | 3,241 | 3,062 | −5.52% |
| 96. | Matlapana | North-West District | 1,449 | 3,043 | +110.01% |
| 97. | Mogorosi | Central District | 2,716 | 3,027 | +11.45% |
| 98. | Tobane | Central District | 2,075 | 3,001 | +44.63% |
| 99. | Mookane | Central District | 2,983 | 3,001 | +0.60% |
| 100. | Mmashoro | Central District | 2,834 | 2,939 | +3.71% |
| 101. | Thebephatshwa Air Base (BDFCamp) | Kweneng District | 2,690 | 2,929 | +8.88% |
| 102. | Mogobane | South-East District | 2,400 | 2,926 | +21.92% |
| 103. | Sowa | Sowa | 3,598 | 2,914 | −19.01% |
| 104. | Thabala | Central District | 2,429 | 2,911 | +19.84% |
| 105. | Ntlhantlhe | Southern District | 2,342 | 2,842 | +21.35% |
| 106. | Dekar | Ghanzi District | 1,668 | 2,814 | +68.71% |
| 107. | Malolwane | Kgatleng District | 2,406 | 2,806 | +16.63% |
| 108. | Seronga | North-West District | 2,674 | 2,796 | +4.56% |
| 109. | Machaneng | Central District | 2,537 | 2,786 | +9.81% |
| 110. | Pandamatenga | Chobe District | 1,798 | 2,750 | +52.95% |
| 111. | Paje | Central District | 2,507 | 2,735 | +9.09% |
| 112. | Molalatau | Central District | 2,396 | 2,703 | +12.81% |
| 113. | Sehithwa | North-West District | 2,748 | 2,703 | −1.64% |
| 114. | Tumasera | Central District | 3,136 | 2,636 | −15.94% |
| 115. | Ditshegwane | Kweneng District | 2,114 | 2,607 | +23.32% |
| 116. | Salajwe | Kweneng District | 2,440 | 2,602 | +6.64% |
| 117. | Mokoboxane | Central District | 1,594 | 2,598 | +62.99% |
| 118. | Mathathane | Central District | 2,672 | 2,587 | −3.18% |
| 119. | Mmathubudukwane | Kgatleng District | 2,203 | 2,517 | +14.25% |
| 120. | Nokaneng | North-West District | 2,067 | 2,510 | +21.43% |
| 121. | Mabutsane | Southern District | 2,386 | 2,507 | +5.07% |
| 122. | Mohembo West | North-West District | 1,770 | 2,500 | +41.24% |
| 123. | Marapong | Central District | 2,283 | 2,493 | +9.20% |
| 124. | Nshakashokwe | Central District | 2,168 | 2,491 | +14.90% |
| 125. | Senete | Central District | 2,440 | 2,457 | +0.70% |
| 126. | Artisia | Kgatleng District | 2,365 | 2,422 | +2.41% |
| 127. | Sojwe | Kweneng District | 3,983 | 2,419 | −39.27% |
| 128. | Mabeleapudi | Central District | 2,247 | 2,407 | +7.12% |
| 129. | Lesenepole | Central District | 3,048 | 2,403 | −21.16% |
| 130. | Mosolotshane | Central District | 2,017 | 2,375 | +17.75% |
| 131. | Tshesebe | North-East District | 2,277 | 2,375 | +4.30% |
| 132. | Matsiloje | North-East District | 2,380 | 2,368 | −0.50% |
| 133. | Otse | Central District | 1,787 | 2,360 | +32.06% |
| 134. | Kalamare | Central District | 2,196 | 2,350 | +7.01% |
| 135. | Ratholo | Central District | 2,236 | 2,338 | +4.56% |
| 136. | Mokobeng | Central District | 2,535 | 2,257 | −10.97% |
| 137. | Ncojane | Ghanzi District | 1,958 | 2,242 | +14.50% |
| 138. | Nswazwi | Central District | 2,185 | 2,239 | +2.47% |
| 139. | Lorolwana | Southern District | 1,568 | 2,225 | +41.90% |
| 140. | Mogapi | Central District | 1,939 | 2,214 | +14.18% |
| 141. | Makobo | Central District | 1,268 | 2,191 | +72.79% |
| 142. | Tsamaya | North-East District | 2,387 | 2,190 | −8.25% |
| 143. | Tsau | North-West District | 2,000 | 2,144 | +7.20% |
| 144. | Mmatseta | Kweneng District | 474 | 2,120 | +347.26% |
| 145. | Seleka | Central District | 1,157 | 2,115 | +82.80% |
| 146. | Maokane | Southern District | 2,044 | 2,098 | +2.64% |
| 147. | Sepopa | North-West District | 2,283 | 2,090 | −8.45% |
| 148. | Mabesekwa | Central District | 1,528 | 2,085 | +36.45% |
| 149. | Moletemane | Central District | 1,664 | 2,077 | +24.82% |
| 150. | Tshimoyapula | Central District | 1,626 | 2,073 | +27.49% |
| 151. | Mosetse | Central District | 1,787 | 2,064 | +15.50% |
| 152. | Lotlhakane West | Southern District | 1,637 | 2,056 | +25.60% |
| 153. | Mokubilo | Central District | 1,917 | 2,047 | +6.78% |
| 154. | Xhumo | Central District | 1,684 | 2,041 | +21.20% |
| 155. | Lehututu | Kgalagadi District | 1,956 | 2,035 | +4.04% |
| 156. | Sesung | Kweneng District | 752 | 2,014 | +167.82% |
| 157. | Moroka | North-East District | 1,692 | 2,000 | +18.20% |
| 158. | Gobojango | Central District | 2,138 | 1,981 | −7.34% |
| 159. | Rakhuna | Southern District | 1,355 | 1,980 | +46.13% |
| 160. | Marobela | Central District | 1,672 | 1,970 | +17.82% |
| 161. | Moshaneng | Southern District | 1,512 | 1,961 | +29.70% |
| 162. | Themashanga | North-East District | 1,648 | 1,955 | +18.63% |
| 163. | Tsootsha | Ghanzi District | 1,848 | 1,911 | +3.41% |
| 164. | Gojwane | Central District | 1,411 | 1,888 | +33.81% |
| 165. | Kauxwhi | North-West District | 2,040 | 1,888 | −7.45% |
| 166. | Kudumatse | Central District | 2,030 | 1,876 | −7.59% |
| 167. | Malatswai | Central District | 1,482 | 1,867 | +25.98% |
| 168. | Mmanoko | Kweneng District | 932 | 1,861 | +99.68% |
| 169. | Toteng | North-West District | 902 | 1,854 | +105.54% |
| 170. | Mabule | Southern District | 2,260 | 1,835 | −18.81% |
| 171. | Maboane | Kweneng District | 1,085 | 1,811 | +66.91% |
| 172. | Makwate | Central District | 1,611 | 1,806 | +12.10% |
| 173. | Lokgwabe | Kgalagadi District | 1,417 | 1,792 | +26.46% |
| 174. | Motlhabaneng | Central District | 1,456 | 1,790 | +22.94% |
| 175. | Dimajwe | Central District | 1,423 | 1,788 | +25.65% |
| 176. | Makopong | Kgalagadi District | 1,697 | 1,788 | +5.36% |
| 177. | Majwaneng | Central District | 1,903 | 1,779 | −6.52% |
| 178. | Zwenshambe | North-East District | 1,943 | 1,776 | −8.59% |
| 179. | Ditladi | North-East District | 1,344 | 1,756 | +30.65% |
| 180. | Mogapinyana | Central District | 1,528 | 1,754 | +14.79% |
| 181. | Magotlhwane | Southern District | 1,433 | 1,751 | +22.19% |
| 182. | Selokolela | Southern District | 1,610 | 1,750 | +8.70% |
| 183. | Lorwana | Southern District | 1,177 | 1,721 | +46.22% |
| 184. | Motokwe | Kweneng District | 1,413 | 1,720 | +21.73% |
| 185. | Mmatshumo | Central District | 1,122 | 1,719 | +53.21% |
| 186. | Moshaweng | Kweneng District | 1,222 | 1,700 | +39.12% |
| 187. | Mosu | Central District | 1,792 | 1,697 | −5.30% |
| 188. | Kokotsha | Kgalagadi District | 1,224 | 1,696 | +38.56% |
| 189. | Kgomokasitwa | Southern District | 1,423 | 1,669 | +17.29% |
| 190. | Samochema | North-West District | 1,149 | 1,667 | +45.08% |
| 191. | Goshwe | Central District | 1,573 | 1,640 | +4.26% |
| 192. | Natale | Central District | 1,288 | 1,638 | +27.17% |
| 193. | Phitshane Molopo | Southern District | 1,945 | 1,625 | −16.45% |
| 194. | New Xade | Ghanzi District | 1,269 | 1,619 | +27.58% |
| 195. | Gamodubu | Kweneng District | 501 | 1,613 | +221.96% |
| 196. | Topisi | Central District | 1,545 | 1,607 | +4.01% |
| 197. | Seolwane | Central District | 1,280 | 1,596 | +24.69% |
| 198. | Xakao | North-West District | 1,565 | 1,594 | +1.85% |
| 199. | Kgagodi | Central District | 1,756 | 1,593 | −9.28% |
| 200. | Zoroga | Central District | 1,358 | 1,592 | +17.23% |
| 201. | Makalamabedi | Central District | 1,674 | 1,591 | −4.96% |
| 202. | Kodibeleng | Central District | 1,298 | 1,589 | +22.42% |
| 203. | Ramatlabama | Southern District | 1,328 | 1,588 | +19.58% |
| 204. | Tshokwe | Central District | 1,070 | 1,586 | +48.22% |
| 205. | Mafongo | Central District | 1,151 | 1,583 | +37.53% |
| 206. | Sikwane | Kgatleng District | 1,466 | 1,580 | +7.78% |
| 207. | Ramokgwebana | North-East District | 1,548 | 1,565 | +1.10% |
| 208. | Kedia | Central District | 1,237 | 1,563 | +26.35% |
| 209. | Etsha 1 | North-West District | 965 | 1,554 | +61.04% |
| 210. | Matobo | Central District | 1,136 | 1,553 | +36.71% |
| 211. | Nlakhwane | North-East District | 1,583 | 1,547 | −2.27% |
| 212. | Damochojena | Central District | 993 | 1,527 | +53.78% |
| 213. | Pitseng | Southern District | 1,074 | 1,526 | +42.09% |
| 214. | Khwee | Central District | 1,196 | 1,509 | +26.17% |
| 215. | Matsitama | Central District | 1,309 | 1,502 | +14.74% |
| 216. | Beetsha | North-West District | 941 | 1,502 | +59.62% |
| 217. | Nxamasere | North-West District | 1,584 | 1,501 | −5.24% |
| 218. | Semolale | Central District | 1,288 | 1,497 | +16.23% |
| 219. | Botlhapatlou | Kweneng District | 1,223 | 1,493 | +22.08% |
| 220. | Senyawe | North-East District | 1,339 | 1,481 | +10.60% |
| 221. | Sekoma | Southern District | 1,190 | 1,471 | +23.61% |
| 222. | Dutlwe | Kweneng District | 1,055 | 1,464 | +38.77% |
| 223. | Makaleng | North-East District | 1,256 | 1,463 | +16.48% |
| 224. | Mapoka | North-East District | 1,789 | 1,457 | −18.56% |
| 225. | Gootau | Central District | 1,401 | 1,455 | +3.85% |
| 226. | Tamasane | Central District | 1,144 | 1,426 | +24.65% |
| 227. | Malwelwe | Kweneng District | 1,146 | 1,414 | +23.39% |
| 228. | Phepheng | Kgalagadi District | 994 | 1,411 | +41.95% |
| 229. | Boatlaname | Kweneng District | 1,049 | 1,405 | +33.94% |
| 230. | Dibete Station | Central District | 1,083 | 1,403 | +29.55% |
| 231. | Kutamogree | Central District | 1,035 | 1,397 | +34.98% |
| 232. | Dinokwe | Central District | 1,229 | 1,392 | +13.26% |
| 233. | Borotsi | Central District | 1,501 | 1,388 | −7.53% |
| 234. | Jackalas 2 | North-East District | 1,222 | 1,388 | +13.58% |
| 235. | Sorilatholo | Kweneng District | 897 | 1,373 | +53.07% |
| 236. | Siviya | North-East District | 1,289 | 1,366 | +5.97% |
| 237. | Kareng | North-West District | 1,259 | 1,361 | +8.10% |
| 238. | Jackalas 1 | North-East District | 1,093 | 1,352 | +23.70% |
| 239. | Pilikwe | Central District | 1,282 | 1,346 | +4.99% |
| 240. | Mmaphashalala | Central District | 1,044 | 1,342 | +28.54% |
| 241. | Ngarange | North-West District | 988 | 1,336 | +35.22% |
| 242. | Lekgolobotlo | Southern District | 1,177 | 1,334 | +13.34% |
| 243. | Tloaneng | Kweneng District | 868 | 1,326 | +52.76% |
| 244. | Hatsalatladi | Kweneng District | 726 | 1,314 | +80.99% |
| 245. | Maape | Central District | 1,337 | 1,314 | −1.72% |
| 246. | Moralane | Central District | 866 | 1,310 | +51.27% |
| 247. | Khawa | Kgalagadi District | 817 | 1,299 | +59.00% |
| 248. | Bray | Kgalagadi District | 1,041 | 1,286 | +23.54% |
| 249. | Kaudwane | Kweneng District | 1,084 | 1,283 | +18.36% |
| 250. | Sehunou | Central District | 1,049 | 1,274 | +21.45% |
| 251. | Shakwe | Central District | 976 | 1,272 | +30.33% |
| 252. | Motopi | Central District | 1,340 | 1,272 | −5.07% |
| 253. | Sekhutlane | Southern District | 871 | 1,266 | +45.35% |
| 254. | Omaweneno | Kgalagadi District | 917 | 1,256 | +36.97% |
| 255. | Mokolodi | Kweneng District | 624 | 1,250 | +100.32% |
| 256. | Motshegaletau | Central District | 958 | 1,238 | +29.23% |
| 257. | Lesoma | Chobe District | 613 | 1,235 | +101.47% |
| 258. | Mabalane | Kgatleng District | 738 | 1,227 | +66.26% |
| 259. | Kuke | Ghanzi District | 833 | 1,226 | +47.18% |
| 260. | Shashe Bridge | North-East District | 1,095 | 1,225 | +11.87% |
| 261. | Keng | Southern District | 992 | 1,220 | +22.98% |
| 262. | Kachikau | Chobe District | 1,356 | 1,214 | −10.47% |
| 263. | Groote Laagte | Ghanzi District | 849 | 1,206 | +42.05% |
| 264. | Serinane | Kweneng District | 787 | 1,198 | +52.22% |
| 265. | Matlhakola | Central District | 996 | 1,192 | +19.68% |
| 266. | Moshopha | Central District | 1,373 | 1,191 | −13.26% |
| 267. | Gasita | Southern District | 1,063 | 1,188 | +11.76% |
| 268. | Mahotshwane | Southern District | 861 | 1,181 | +37.17% |
| 269. | Mulambakwena | North-East District | 974 | 1,177 | +20.84% |
| 270. | Tlhankane | Southern District | 722 | 1,154 | +59.83% |
| 271. | Sepako | Central District | 682 | 1,152 | +68.91% |
| 272. | Mosojane | North-East District | 1,210 | 1,145 | −5.37% |
| 273. | Kokong | Southern District | 928 | 1,141 | +22.95% |
| 274. | Leologane | Kweneng District | 823 | 1,128 | +37.06% |
| 275. | Ngware | Kweneng District | 919 | 1,124 | +22.31% |
| 276. | Gani | North-West District | 727 | 1,119 | +53.92% |
| 277. | Malaka | Central District | 1,044 | 1,112 | +6.51% |
| 278. | West Hanahai | Ghanzi District | 662 | 1,101 | +66.31% |
| 279. | Gathwane | Southern District | 879 | 1,099 | +25.03% |
| 280. | Karakobis | Ghanzi District | 881 | 1,096 | +24.40% |
| 281. | Tshane | Kgalagadi District | 1,020 | 1,092 | +7.06% |
| 282. | Borotsi | Central District | 942 | 1,086 | +15.29% |
| 283. | Bodibeng | North-West District | 778 | 1,083 | +39.20% |
| 284. | Mogonye | Southern District | 577 | 1,081 | +87.35% |
| 285. | Jamataka | Central District | 650 | 1,079 | +66.00% |
| 286. | Mogomotho | North-West District | 843 | 1,078 | +27.88% |
| 287. | Mokhomba | Southern District | 959 | 1,077 | +12.30% |
| 288. | Lepokole | Central District | 955 | 1,051 | +10.05% |
| 289. | Dagwi | Central District | 454 | 1,048 | +130.84% |
| 290. | Magoriapitse | Southern District | 846 | 1,048 | +23.88% |
| 291. | Mmeya | Central District | 752 | 1,043 | +38.70% |
| 292. | Qabo | Ghanzi District | 762 | 1,042 | +36.75% |
| 293. | Metlobo | Southern District | 891 | 1,039 | +16.61% |
| 294. | Malotwana Siding | Kgatleng District | 608 | 1,037 | +70.56% |
| 295. | Shorobe | North-West District | 1,031 | 1,027 | −0.39% |
| 296. | Qangwa | North-West District | 683 | 1,018 | +49.05% |
| 297. | Kumaga | Central District | 758 | 1,016 | +34.04% |
| 298. | Pitsana-Potokwe | Southern District | 816 | 1,012 | +24.02% |
| 299. | Segwagwa | Southern District | 1,056 | 1,008 | −4.55% |
| 300. | Dovedale | Central District | 832 | 1,006 | +20.91% |
| 301. | Chobokwane | Ghanzi District | 771 | 1,005 | +30.35% |
| 302. | Parakarungu | Chobe District | 845 | 1,005 | +18.93% |
| 303. | Mmadikola | Central District | 830 | 1,004 | +20.96% |
| 304. | Mokgenene | Central District | 835 | 1,000 | +19.76% |
- ^ a b "Population of towns, villages and associated localities" (PDF). 2011 Population and Housing Census. Central Statistics Office. Retrieved 4 January 2024.
- ^ a b "Population of towns, villages and associated localities" (PDF). 2022 Population and Housing Census. Central Statistics Office. Retrieved 4 January 2024.