Visual representation of the spectrum of frequencies of a signal as it varies with time
"Sonograph" redirects here. For the musical recording, see Sonograph (EP).
For the scientific instrument, see Optical spectrograph.
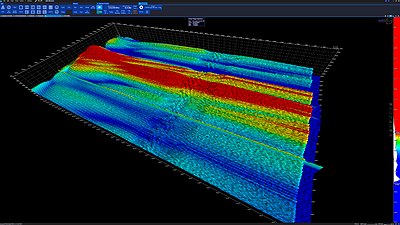
Spectrogram of the spoken words "nineteenth century". Frequencies are shown increasing up the vertical axis, and time on the horizontal axis. The legend to the right shows that the color intensity increases with the density.A 3D spectrogram: The RF spectrum of a battery charger is shown over time
A spectrogram is a visual representation of the spectrum of frequencies of a signal as it varies with time.
When applied to an audio signal, spectrograms are sometimes called sonographs, voiceprints, or voicegrams. When the data are represented in a 3D plot they may be called waterfall displays.
Spectrograms are used extensively in the fields of music, linguistics, sonar, radar, speech processing,[1] seismology, ornithology, and others. Spectrograms of audio can be used to identify spoken words phonetically, and to analyse the various calls of animals.
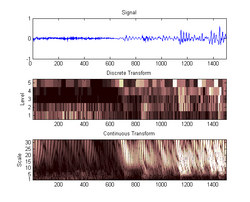
A spectrogram can be generated by an optical spectrometer, a bank of band-pass filters, by Fourier transform or by a wavelet transform (in which case it is also known as a scaleogram or scalogram).[2]
Scaleograms from the DWT and CWT for an audio sample
A spectrogram is usually depicted as a heat map, i.e., as an image with the intensity shown by varying the colour or brightness.
^JL Flanagan, Speech Analysis, Synthesis and Perception, Springer- Verlag, New York, 1972
^Sejdic, E.; Djurovic, I.; Stankovic, L. (August 2008). "Quantitative Performance Analysis of Scalogram as Instantaneous Frequency Estimator". IEEE Transactions on Signal Processing. 56 (8): 3837–3845. Bibcode:2008ITSP...56.3837S. doi:10.1109/TSP.2008.924856. ISSN 1053-587X. S2CID 16396084.
A spectrogram is a visual representation of the spectrum of frequencies of a signal as it varies with time. When applied to an audio signal, spectrograms...
is used. Spectrogram is one of the most popular time-frequency representation, and generalized spectrogram, also called "two-window spectrogram", is the...
is a technique for sharpening a time-frequency representation (e.g. spectrogram or the short-time Fourier transform) by mapping the data to time-frequency...
is moving ice in Antarctica. Sound spectrograms of vibrations caused by friction closely resemble the spectrogram of the Slow Down. This suggests the...
allows the user to insert a digital image as the spectrogram. MetaSynth will then convert the spectrogram to digital sound and "play" the picture. According...
the spectrogram can be configured. There are three types of spectrogram: generic spectrogram melodic-range spectrogram peak-frequency spectrogram Generic...
creating a time-frequency graph called a spectrogram. Any piece of audio can be translated into a spectrogram. Each piece of audio is split into segments...
text can be converted into a soundfile, which is then analysed with a spectrogram to reveal the image. Various artists have used this method to conceal...
cryoseism (also known as an ice quake). Numerous ice quakes share similar spectrograms with Bloop, as well as the amplitude necessary to detect them despite...
such as rotational speed. Waterfall plots are also often used to depict spectrograms or cumulative spectral decay[definition needed] (CSD). The results of...
impression of several tones being sung at once. Spectrograms may be used to visualise formants. In spectrograms, it can be hard to distinguish formants from...
Spectrogram of a linear chirp. The spectrogram plot demonstrates the linear rate of change in frequency as a function of time, in this case from 0 to 7...
years before returning with a video titled "º" which featured audio of a spectrogram featuring the clowns with bold text on the top that read "WE ARE IN A...
existing open-source model for generating images from text prompts, on spectrograms. This results in a model which uses text prompts to generate image files...
information types include frequency spectrum, stereo field, surround field, spectrogram, and more. Computer audition – Study of understanding of audio by machine...
Spectrogram of humpback whale vocalizations. Detail is shown for the first 24 seconds of the 37-second recording of humpback whale song. Spectrogram generated...
Frequency-selective time-varying fading causes a cloudy pattern to appear on a spectrogram. Time is shown on the horizontal axis, frequency on the vertical axis...
appear as a single high-amplitude spike in the time-domain data. On a spectrogram, a sferic appears as a vertical stripe (reflecting its broadband and...
1997, where it reported using spectrogram in doing in vivo DOCT. The same disadvantages occur when using the spectrogram method to do in vivo tissue structure...
nearly 20 years, Turkalo has spent the majority of her time using a spectrogram to record the noises that the elephants make. After extensive observation...
represent flow towards and away from the transducer, respectively. The spectrogram below the B-mode image shows flow velocity (m/s) against time (s) obtained...
 Global Information