 Global Information
Reported Road Casualties Great Britain information
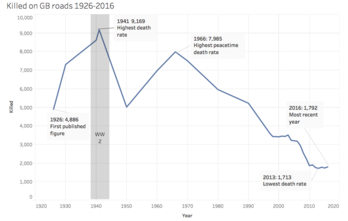
Reported Road Casualties Great Britain (RRCGB), formerly Road Casualties Great Britain (RCGB) and before that Road Accidents Great Britain (RAGB), is the official statistical publication of the UK Department for Transport (DfT) on traffic casualties, fatalities and related road safety data. This publication, first produced in 1951, is the primary source for data on road casualties in Great Britain. It is based primarily on police STATS19 data. Data has been collected since 1926. In 1987, the government set the first national casualty reduction target. The target set was that road casualties should drop by one-third by the year 2000 in comparison to the average numbers for the years 1981 to 1985. The target was exceeded, with the number of fatalities dropping by 39% and the number of serious injuries dropping by 45% over that period.[3]
In 1999, when Great Britain had the safest roads in Europe apart from Sweden, the government set a new national casualty reduction target, to be met by the year 2010. The target for 2010, compared to the average for the years 1994 to 1998, was a reduction of 40% in the number of people Killed or Seriously Injured (KSI) casualties, a reduction of 50% the number of children KSI casualties and a reduction of 10% in the rate of people slightly injured per 100 million vehicle kilometres.[3] By 2009, the results were: killed or seriously injured 44% lower; children killed or seriously injured 61% lower and the slight casualty rate was 37% lower.[n 4] The remainder of the UK casualty statistics, those from Northern Ireland, are reported separately by the ign=right|278,000 |align=right|317,000||[n 1][1]|| |- |align=right|2000 |align=right|3,409 |align=right|38,000 |align=right|279,000 |align=right|317,000||[n 1][1]|| |- |align=right|2001 |align=right|3,450 |align=right|37,000 |align=right|273,000 |align=right|310,000||[n 1][1]|| |- |align=right|2002 |align=right|3,431 |align=right|36,000 |align=right|263,000 |align=right|299,000||[n 1][1]|| |- |align=right|2003 |align=right|3,508 |align=right|34,000 |align=right|253,000 |align=right|287,000||[n 1][1]|| |- |align=right|2004 |align=right|3,221 |align=right|31,000 |align=right|245,000 |align=right|278,000||[n 1][1]|| |- |align=right|2005 |align=right|3,201 |align=right|29,000 |align=right|238,862 |align=right|268,000||[2]|| |- |align=right|2006 |align=right|3,172 |align=right|29,000 |align=right|226,559 |align=right|255,000||[n 2]|| |- |align=right|2007 |align=right|2,946 |align=right|28,000 |align=right|217,060 |align=right|245,000||[n 2]|| |- |align=right|2008 |align=right|2,538 |align=right|26,000 |align=right|202,333 |align=right|228,000||[n 2]|| |- |align=right|2009 |align=right|2,222 |align=right|24,690 |align=right|195,234 |align=right|222,146||[n 3]|| |- |align=right|2010 |align=right|1,857 |align=right|20,803 |align=right|185,995 |align=right|206,798||[3]||Traffic levels fell by 2%. |- |align=right|2011 |align=right|1,901 |align=right|23,122 |align=right|178,927 |align=right|203,950||[4]||First increase in fatalities since 2001. Pedestrian fatalities increased by 12%, car occupants by 6%. They were lower for all other groups. |- |align=right|2012 |align=right|1,754 |align=right|23,039 |align=right|170,930 |align=right|193,969||[5]||10% increase in deaths of cyclists[6] and increasing serious injuries of pedestrians. |- |align=right|2013 |align=right|1,713 |align=right|21,657 |align=right|160,300 |align=right|181,957||[7]||Lowest death rate since records began. |- |align=right|2014 |align=right|1,775 |align=right|22,807 |align=right|169,895 |align=right|194,477 |[8] |Death and KSI rate rise for a 2nd time since 2001. |- |align=right|2015 |align=right|1,732 |align=right|22,137 |align=right|162,340 |align=right|186,209 |[9] |Second lowest annual total on record after 2013. |- |align=right|2016 |align=right|1,792 |align=right|24,101 |align=right|155,491 |align=right|179,592 |[10] |4% rise in deaths to highest level since 2011.[11] |- |align=right|2017 |align=right|1,793 |align=right|24,831 |align=right|144,369 |align=right|170,993 |[12] | |- |align=right|2018 |align=right|1,782 |align=right|25,484 |align=right|133,112 |align=right|160,378 |[13] | |- |align=right|2019 |align=right|1,752 |align=right|25,945 (30,144) |align=right|125,461 (121,262) |align=right|153,158 |[14] |Comparison of this figure with earlier years should be interpreted with caution due to changes in systems for severity reporting by some police forces. The numbers given in bold are adjusted estimates following methodology from the Office for National Statistics Methodology Advisory Service analysis accounting for change in severity reporting (see page 7).[15] |- |align=right|2020 |align=right|1,460 |align=right|20,102 (22,069) |align=right|92,055 (94,022) |align=right|115,584 |[16] |Figures affected by Covid19 pandemic |- |align=right|2021 |align=right|1,558 |align=right|23,363 (25,892) |align=right|103,288 (100,759) |align=right|128,209 |[17] | |- |align=right|2022 (provisional) |align=right|1,695 |align=right|(28,101) |align=right|(106,206) |align=right|136,002 |[18] | |- |}
Cite error: There are <ref group=n> tags on this page, but the references will not show without a {{reflist|group=n}} template (see the help page).
- ^ a b c d e f "TSGB 2009 Chapter 8: Casualties by Type - data tables". Department for Transport. Retrieved 11 January 2010.
- ^ "Road Casualties Great Britain: 2005". Department for Transport. p. 6. Archived from the original on 9 February 2010. Retrieved 9 January 2010.
- ^ "Reported road casualties in Great Britain: main results 2010".
The number of people killed in road accidents reported to the police fell by 16% from 2,222 in 2009 to 1,857 in 2010. This the lowest figure since national records began in 1926. A total of 22,660 people were reported killed or seriously injured in 2010, 8% less than in 2009. There were 208,655 casualties (slight injuries, serious injuries and fatalities) in road accidents reported to the police in Great Britain in 2010, 6% less than in 2009. Motor vehicle traffic levels fell by 2% compared to 2009.
- ^ "Reported road casualties Great Britain: main results 2011". Department for Transport. Retrieved 28 June 2012.
- ^ "Reported road casualties Great Britain: main results 2012". Department for Transport. Retrieved 28 June 2012.
- ^ More Or Less, BBC Radio 4
- ^ "Reported road casualties Great Britain: main results 2013". Department for Transport. Retrieved 25 July 2014.
- ^ "Reported road casualties in Great Britain: main results 2014 - Publications - GOV.UK". www.gov.uk. Retrieved 14 April 2016.
- ^ "Reported road casualties in Great Britain, main results: 2015". www.gov.uk. Retrieved 9 October 2016.
- ^ "Reported road casualties Great Britain, annual report: 2016". www.gov.uk. Retrieved 29 September 2017.
- ^ "'Daily carnage' sees 4% rise in road deaths". Highways Magazine. 28 September 2017.
- ^ "Reported road casualties Great Britain, annual report: 2017" (PDF). www.gov.uk. Retrieved 10 November 2018.
- ^ "Reported road casualties Great Britain, annual report: 2018" (PDF). www.gov.uk. Retrieved 27 July 2019.
- ^ "Reported road casualties in Great Britain: 2019 annual report" (PDF). www.gov.uk. Retrieved 18 March 2021.
- ^ "Reported road casualties in Great Britain: 2019 annual report" (PDF). www.gov.uk. Retrieved 18 March 2021.
- ^ "Reported road casualties Great Britain, annual report: 2020". www.gov.uk. Retrieved 29 October 2021.
- ^ "Reported road casualties Great Britain, annual report: 2021". www.gov.uk. Retrieved 25 May 2023.
- ^ "Reported road casualties Great Britain, annual report: 2021". www.gov.uk. Retrieved 25 May 2023.