Graphic procedure in the geochemical interpretation of water-analyses
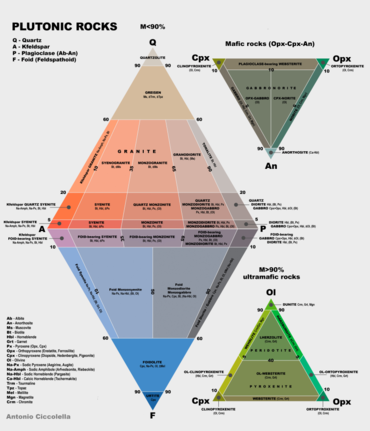
A piper diagram and two ternary diagrams on the composition of intrusive volcanic rocks; see QAPF diagram
A Piper diagram is a graphic procedure proposed by Arthur M. Piper in 1944 for presenting water chemistry data to help in understanding the sources of the dissolved constituent salts in water. This procedure is based on the premise that cations and anions in water are in such amounts to assure the electroneutrality of the dissolved salts, in other words the algebraic sum of the electric charges of cations and anions is zero.[1]
Piper diagram of water samples from the Mtshabezi River, Zimbabwe. Data source:[2]
A Piper diagram is a graphical representation of the chemistry of a water sample or samples.
The cations and anions are shown by separate ternary plots. The apexes of the cation plot are calcium, magnesium and sodium plus potassium cations. The apexes of the anion plot are sulfate, chloride and carbonate plus hydrogen carbonate anions. The two ternary plots are then projected onto a diamond.[3] The diamond is a matrix transformation of a graph of the anions (sulfate + chloride/ total anions) and cations (sodium + potassium/total cations).[4]
The Piper diagram is suitable for comparing the ionic composition of a set of water samples, but does not lend itself to spatial comparisons. For geographical applications, the Stiff diagram and Maucha diagram are more applicable, because they can be used as markers on a map.[5] Colour coding of the background of the Piper diagram allows linking Piper Diagrams and maps[6]
Water samples shown on the Piper diagram can be grouped in hydrochemical facies.[7] The cation and anion triangles can be separated in regions based on the dominant cation(s) or anion(s) and their combination creates regions in the diamond shaped part of the diagram.
^Piper, Arthur (1944). "A graphic procedure in the geochemical interpretation of water-analyses". Transactions, American Geophysical Union. 25 (6): 914–928. Bibcode:1944TrAGU..25..914P. doi:10.1029/TR025i006p00914.
^Love, D.; Moyce, W.; Ravengai, S. (2006). "Livelihood challenges posed by water quality in the Mzingwane and Thuli river catchments, Zimbabwe" (PDF). 7th WaterNet/WARFSA/GWP-SA Symposium, Lilongwe, Malawi. Archived from the original (PDF) on 2011-07-24. Retrieved 2008-06-20.
^Piper, A.M. (1953). A Graphic Procedure in the Geochemical Interpretation of Water Analysis. Washington D.C.: United States Geological Survey. OCLC 37707555. ASIN B0007HRZ36.
^Rao, N. Srinivasa (December 1998). "MHPT.BAS: a computer program for modified Hill–Piper diagram for classification of ground water". Computers & Geosciences. 24 (10): 991–1008. Bibcode:1998CG.....24..991R. doi:10.1016/S0098-3004(98)00083-1.
^Peeters, Luk (2014-01-01). "A Background Color Scheme for Piper Plots to Spatially Visualize Hydrochemical Patterns". Groundwater. 52 (1): 2–6. doi:10.1111/gwat.12118. ISSN 1745-6584. PMID 24102292. S2CID 205152097.
^Sadashivaiah, C.; Ramakrishnaiah, C.R.; Ranganna, G. (2008). "Hydrochemical Analysis and Evaluation of Groundwater Quality in Tumkur Taluk, Karnataka State, India". International Journal of Environmental Research and Public Health. 5 (3): 158–164. doi:10.3390/ijerph5030158. PMC 3699986. PMID 19139534.
A Piperdiagram is a graphic procedure proposed by Arthur M. Piper in 1944 for presenting water chemistry data to help in understanding the sources of...
Look up Piper or piper in Wiktionary, the free dictionary. Piper may refer to: Piper (given name) Piper (surname) Piper (Morlock), in the Marvel Universe...
symbol is similar in concept to the Stiff diagram. It conveys similar ionic information to the Piperdiagram, though in a more compact format that is suitable...
Following process industry disasters such as the 1984 Bhopal disaster and 1988 Piper Alpha explosion, in 1992 the United States Department of Labor Occupational...
website "Diagram of North Las Vegas Airport (VGT)" (PDF). Archived from the original (PDF) on 2012-02-13. from Nevada DOT FAA Airport Diagram (PDF), effective...
according to their purpose. A floor plan is the most fundamental architectural diagram, a view from above showing the arrangement of spaces in a building in the...
of explosive decompression and died in the positions indicated by the diagram. Investigation by forensic pathologists determined that Hellevik, being...
Nanney, Lillian B.; Fleckman, Philip; King, Lloyd E. (2018-01-01), Treuting, Piper M.; Dintzis, Suzanne M.; Montine, Kathleen S. (eds.), "24 - Skin and Adnexa"...
circle in clear weather was about 3 km (2 mi). Jahre Viking A comparison diagram of the Knock Nevis with several large buildings. From left to right: Eiffel...
databases and tracking systems were gradually developed, including Gabbard diagrams, to improve the modeling of orbital evolution and decay. When the NORAD...
include a 1735 map of Boston; a 2006 Yamaha YZ250 dirt bike; and a 1976 Piper Warrior airplane. After Chumlee buys a fake etching for $300, Rick tries...
current SAT delay information FAA Airport Diagram (PDF), effective June 13, 2024 OAG Schedules for SAT Display – Management Airport diagram for March 1962...
instructor. Their fleet includes several Cessna 152s, a few Piper Warrior IIs, Piper Arrow IV, and a Piper Seminole. Lane Aviation Academy is located at the southern...
leaves Black a piece ahead. 28... Ng4 29. Qg2 (first diagram) Rf3!! 30. c4 Kh6!! (second diagram) Now all of White's piece moves allow checkmate or ....
" The Piper disappeared from Air Traffic Control's radar at about 1300 feet. Later the United States Coast Guard discovered pieces of the Piper in the...
Aeroméxico Flight 498 or Cerritos air disaster happened in 1986, when a private Piper Cherokee owned by William Kramer en route from Torrance to Big Bear City...
to finance its new refining facility in the U.S. Also, suppose that the Piper Shoe Company, a U. S. company, plans to issue US$150 million in bonds at...
concept for guitar. Mel Bay Publications. ISBN 0786644834. Clendinning, Jane Piper; Marvin, Elizabeth West (2005). The musician's guide to theory and analysis...
spectrum is an example of a one-dimensional spatial model. The accompanying diagram presents a simple one-dimensional spatial model, illustrating the voting...
"Arnold Layne" and "See Emily Play", and the successful debut album The Piper at the Gates of Dawn (all 1967). David Gilmour (guitar, vocals) joined in...
 Global Information