A "hockey pencil" imitating the shape of an ice hockey stick, with the eraser being the blade; its bottom edge here is a fair representation of a hockey stick graph. If the graph starts above zero and drops a little before rising, it may be called a J curve.
A hockey stick graph or hockey stick curve is a graph, or curve shape, that resembles an ice hockey stick, in that it turns sharply from a nearly flat "blade" to a long "handle".
In economics,[1][2]
marketing,[3]
and dose–response relationships,[4][5]
a hockey stick graph is one in which the "blade" is near zero (hugging the floor) before the graph turns upward to a long nearly straight increasing section. By contrast, in climate science, the well-known hockey stick graph (global temperature) describing 1000 years of global or hemispheric temperature has the "handle" horizontal and "blade" turning upward.[6] This difference of viewpoint is remarked on in a 2020 novel about climate change:
Insurance companies in a panic at last year's reports. Pay-outs at about one hundred billion USD a year now, going higher fast, as in hockey stick graph. Insurance companies insured by re-insurance. These now holding short end of stick (tall end of stick?).
— Kim Stanley Robinson, The Ministry for the Future: A Novel
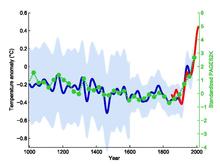
The northern hemisphere hockey stick graph – smoothed curve shown in blue with its uncertainty range in light blue, overlaid with green dots showing the 30-year global average of the 2013 reconstruction. The red curve shows measured global mean temperature, according to HadCRUT4 data from 1850 to 2013.Functions with a hockey stick curve shape that bound or approximate the median of a gamma distribution
^Society of Plastics Engineers. Technical Conference Proceedings, Part I. Society of Plastics Engineers. 1985. Retrieved 17 August 2022. The hockey-stick graph, which shows a magnificent turnaround in our business starting tomorrow, is familiar to all. This is partly the fault of marketing managers who, by nature, tend to be optimists; but it is also the fault of top management, who will not accept any project that promises less than spectacular results.
^Taylor, John B. (1995). Economics. Houghton Mifflin. p. 33. ISBN 9780395660300. Retrieved 17 August 2022. The long handle of the hockey stick is the sharp increase in the debt in the 1980s and 1990s. The part of the hockey stick that you hit the ball or puck with represents slower increases ...
^
Halfmill, Tom (July 1999). "Who Will Wire Your Home?". Maximum PC: 37. Retrieved 17 August 2022. As usual, industry pundits are trotting out their all-purpose hockey-stick graphs to show that home networking will soon be a huge market.
^
Yanagimoto, Takemi; Eiji Yamamoto (1979). "Estimation of safe doses: critical review of the hockey stick regression method". Environmental Health Perspectives. 32: 193–199. doi:10.1289/ehp.7932193. PMC 1637920. PMID 540593. The hockey stick regression method is a convenient method to estimate safe doses, which is a kind of regression method using segmented lines.
^Cornfield, Jerome (18 November 1977). "Carcinogenic Risk Assessment". Science. 198 (4318): 693–699. Bibcode:1977Sci...198..693C. doi:10.1126/science.910152. PMID 910152. Retrieved 17 August 2022. A simplified model in which a toxic substance is activated and deactivated in separate and simultaneous reactions is presented and the dose response curve implied by the model is deduced. This curve has the general form of a hockey stick, with the striking part flat or nearly flat until the dose administered saturates the deactivation system, after which the probability of a response rises rapidly.
^
Kerr, Richard A (2006). "Yes, it's been getting warmer in here since the CO2 began to rise". Science. 312 (5782): 1854. doi:10.1126/science.312.5782.1854. PMID 16809492. S2CID 8266929. The resulting temperature curve sloped gently downward for most of the millennium (the handle of the hockey stick), then rose sharply into the 20th century (the blade) ...
and 24 Related for: Hockey stick graph information
Hughes (MBH99), which has been referred to as the "hockeystickgraph". This graph extended the similar graph in Figure 3.20 from the IPCC Second Assessment...
An ice hockeystick is a piece of equipment used in ice hockey to shoot, pass, and carry the puck across the ice. Ice hockey sticks are approximately...
made statistical critiques, with economist Ross McKitrick, of the hockeystickgraph which shows that the increase in late 20th century global temperatures...
Hughes, on the 1999 reconstruction that was the first to be dubbed the hockeystickgraph. He concisely explains the basics of climate science including statistical...
publisher who publishes a blog called 'Bishop Hill', writes about the "hockeystickgraph" of global temperatures for the last 1000 years. The book has been...
publication of Montford's book The HockeyStick Illusion, his discussions of objections to the Hockeystickgraph had been featured in his blog, in particular...
defamation lawsuit filed in 2012 against bloggers who attacked his hockeystickgraph of global temperature rise, one of the bloggers having called Mann's...
National Review blog post by Steyn cited it and alleged that Mann's hockeystickgraph was "fraudulent". Mann asked CEI and National Review to remove the...
Ocean. historical temperature record See global temperature record. hockeystickgraph Reconstructions of Northern Hemisphere or global mean temperature...
having published a temperature reconstruction which resembled the hockeystickgraph. Morano says that emails targeting climate scientists can be nasty...
runner-up for the Donner Prize. McKitrick was involved in disputing hockeystickgraph temperature reconstructions. "Ross McKitrick". DeSmog. McKitrick,...
denies global warming and called Michael E. Mann's controversial hockeystickgraph a fake, or rather based on bad math; there is no strong model ubiquitously...
the polar regions. He significantly contributed to creating the "hockeystickgraph" that shows a growing increase of global mean temperatures in recent...
Australia Guy Pearse 2007 The HockeyStick and the Climate Wars: Dispatches from the Front Lines Climate change: hockeystickgraph Michael E. Mann 2012 ISBN 0-23115254-X...
Research. In the review, the authors expressed disagreement with the hockeystickgraph and argued that historical temperature changes were related to solar...
event – Rapid global cooling around 8,200 years ago Hockeystickgraph (global temperature) – Graph in climate science Little Ice Age – Climatic cooling...
temperature fluctuations in the last millennium. Critics of the "hockeystickgraph" of all subsequent reports have claimed that the record of the MWP...
Process - Hell and High Water - History of climate change science - Hockeystickgraph - Holocene - Holocene Climatic Optimum - Holocene extinction - Homogenization...
Global temperatures are rising at a rapid, unprecedented rate. The "hockeystick" graph proves that the earth has experienced a steady, very gradual temperature...
have defended scientific research against allegations made about the hockeystickgraph. During the 2009-2010 Climatic Research Unit email controversy, he...
require are policies to incentivize the needed shift." Mann's famous "hockeystick" graph led to death threats and online attacks. He later became an expert...
United States by scientists led by Michael E. Mann, saying that the hockeystickgraph it showed was a genuine effect, but he had an "uneasy feeling" about...
 Global Information