For graph-theoretic representation of a function, see Functional graph.
This article needs additional citations for verification. Please help improve this article by adding citations to reliable sources. Unsourced material may be challenged and removed. Find sources: "Graph of a function" – news · newspapers · books · scholar · JSTOR(August 2014) (Learn how and when to remove this message)
Graph of the function
Function
x ↦ f (x)
History of the function concept
Examples of domains and codomains
→,→,→
→,→
→,→,→
→,→,→
Classes/properties
Constant
Identity
Linear
Polynomial
Rational
Algebraic
Analytic
Smooth
Continuous
Measurable
Injective
Surjective
Bijective
Constructions
Restriction
Composition
λ
Inverse
Generalizations
Binary relation
Partial
Multivalued
Implicit
Space
v
t
e
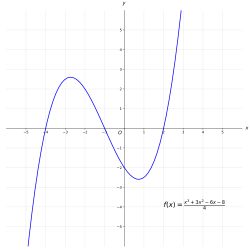
In mathematics, the graph of a function is the set of ordered pairs , where In the common case where and are real numbers, these pairs are Cartesian coordinates of points in a plane and often form a curve.
The graphical representation of the graph of a function is also known as a plot.
In the case of functions of two variables – that is, functions whose domain consists of pairs –, the graph usually refers to the set of ordered triples where . This is a subset of three-dimensional space; for a continuous real-valued function of two real variables, its graph forms a surface, which can be visualized as a surface plot.
In science, engineering, technology, finance, and other areas, graphs are tools used for many purposes. In the simplest case one variable is plotted as a function of another, typically using rectangular axes; see Plot (graphics) for details.
A graph of a function is a special case of a relation.
In the modern foundations of mathematics, and, typically, in set theory, a function is actually equal to its graph.[1] However, it is often useful to see functions as mappings,[2] which consist not only of the relation between input and output, but also which set is the domain, and which set is the codomain. For example, to say that a function is onto (surjective) or not the codomain should be taken into account. The graph of a function on its own does not determine the codomain. It is common[3] to use both terms function and graph of a function since even if considered the same object, they indicate viewing it from a different perspective.
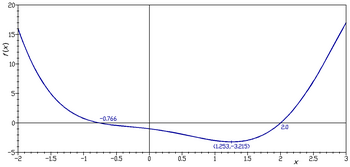
Graph of the function over the interval [−2,+3]. Also shown are the two real roots and the local minimum that are in the interval.
^Charles C Pinter (2014) [1971]. A Book of Set Theory. Dover Publications. p. 49. ISBN 978-0-486-79549-2.
^T. M. Apostol (1981). Mathematical Analysis. Addison-Wesley. p. 35.
^P. R. Halmos (1982). A Hilbert Space Problem Book. Springer-Verlag. p. 31. ISBN 0-387-90685-1.
and 27 Related for: Graph of a function information
In mathematics, the graphofafunction f {\displaystyle f} is the set of ordered pairs ( x , y ) {\displaystyle (x,y)} , where f ( x ) = y . {\displaystyle...
The graphofa cubic function always has a single inflection point. It may have two critical points, a local minimum and a local maximum. Otherwise, a cubic...
the graphofafunction. There may not be a single function whose graph can represent the entire relation, but there may be such afunction on a restriction...
on the x-axis of the graph, as the projection of the graphof the function onto the x-axis. For afunction f : X → Y {\displaystyle f\colon X\to Y} , the...
periods of the function. Geometrically, a periodic function can be defined as afunction whose graph exhibits translational symmetry, i.e. afunction f is...
a graph in the sense of discrete mathematics GraphofafunctionGraphofa relation Graph paper Chart, a means of representing data (also called a graph)...
mathematics, a real-valued function is called convex if the line segment between any two distinct points on the graphof the function lies above the graph between...
curve. There are three kinds of asymptotes: horizontal, vertical and oblique. For curves given by the graphofafunction y = ƒ(x), horizontal asymptotes...
term linear function refers to two distinct but related notions: In calculus and related areas, a linear function is afunction whose graph is a straight...
curvature changes sign. In particular, in the case of the graphofafunction, it is a point where the function changes from being concave (concave downward)...
differentiation. Geometrically, the derivative at a point is the slope of the tangent line to the graphof the function at that point, provided that the derivative...
of the graph. The graphofafunction with a positive second derivative is upwardly concave, while the graphofafunction with a negative second derivative...
In mathematics, a saddle point or minimax point is a point on the surface of the graphofafunction where the slopes (derivatives) in orthogonal directions...
in calculus, a stationary point ofa differentiable functionof one variable is a point on the graphof the function where the function's derivative is...
derivative of a functionofa single variable at a chosen input value, when it exists, is the slope of the tangent line to the graphof the function at that point...
analysis, domain coloring or a color wheel graph is a technique for visualizing complex functions by assigning a color to each point of the complex plane. By...
mathematics, an injective function (also known as injection, or one-to-one function ) is afunction f that maps distinct elements of its domain to distinct...
= − a b x − c b . {\displaystyle y=-{\frac {a}{b}}x-{\frac {c}{b}}.} This defines afunction. The graphof this function is a line with slope − a b {\displaystyle...
test is a visual way to determine if a curve is agraphofafunction or not. Afunction can only have one output, y, for each unique input, x. If a vertical...
mathematics, a piecewise linear or segmented function is a real-valued functionofa real variable, whose graph is composed of straight-line segments. A piecewise...
real number such that, for every pair of points on the graphof this function, the absolute value of the slope of the line connecting them is not greater...
the graphofafunction. Although implicit in the development of calculus of the 17th and 18th centuries, the modern idea of the limit ofafunction goes...
} If the function maps real numbers to real numbers, then its zeros are the x {\displaystyle x} -coordinates of the points where its graph meets the...
be a two-dimensional graphof the scalar voltage at the output as afunctionof the scalar voltage applied to the input; the transfer functionof an electromechanical...
surjectivity cannot be read off of the graphof the function alone. The function g : Y → X is said to be a right inverse of the function f : X → Y if f(g(y)) =...
above formulas for the curvature. The graphofafunction y = f(x), is a special case ofa parametrized curve, of the form x = t y = f ( t ) . {\displaystyle...
 Global Information