 Global Information
Economy of the European Union information
This article needs to be updated. (March 2023) |
 Paris, the largest and richest metropolis in the EU | |
| Currency | Euro (EUR, €) and 7 others |
|---|---|
Fiscal year | Calendar year |
Trade organisations | WTO, G20, G7 and others |
| Statistics | |
| Population | |
| GDP |
|
GDP growth |
|
GDP per capita |
|
GDP by sector |
|
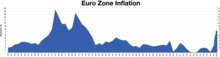
Inflation (CPI) |
|
Population below poverty line |
|
Gini coefficient | |
Human Development Index |
|
Labour force |
|
Labour force by occupation |
|
| Unemployment |
|
Average gross salary | €2,792 monthly (2021)[11] |
Average net salary | €2,178 monthly (2022)[12] |
Main industries |
|
| External | |
| Exports | $8.705 trillion (2021 est.)[13] |
Export goods | machinery, motor vehicles, pharmaceuticals and other chemicals, fuels, aircraft, plastics, iron and steel, wood pulp and paper products, alcoholic beverages, furniture |
Main export partners |
|
| Imports | $8.037 trillion (2021 est.)[13] |
Import goods | fuels and crude oil, machinery, vehicles, pharmaceuticals and other chemicals, precious gemstones, textiles, aircraft, plastics, metals, ships |
Main import partners |
|
FDI stock |
|
Current account | |
Gross external debt | $13.05 trillion (31 December 2014 est.)[13] |
Net international investment position | |
| Public finances | |
Government debt |
|
Budget balance |
|
| Revenues | 46.9% of GDP (EU27; 2021)[19] |
| Expenses | 51.6% of GDP (EU27; 2021)[19] |
| Economic aid | donor: ODA, $87.64 billion[21] |
Credit rating |
|
Foreign reserves | $0.6 trillion (2010)[24] |
Main data source: CIA World Fact Book All values, unless otherwise stated, are in US dollars. | |
The economy of the European Union is the joint economy of the member states of the European Union (EU). It is the second largest economy in the world in nominal terms, after the United States, and the third largest at purchasing power parity (PPP), after China and the US. The European Union's GDP is estimated to be $19.35 trillion (nominal) in 2024[2] or $26.64 trillion (PPP), representing around one-sixth of the global economy.[25] Germany has the biggest national GDP of all EU countries, followed by France and Italy.
The euro is the second largest reserve currency and the second most traded currency in the world after the United States dollar.[26][27][28] The euro is used by 20 of its 27 members, overall, it is the official currency in 26 countries, in the eurozone and in six other European countries, officially or de facto. The EU as a region has produced the world's second-highest number of Nobel laureates in the economics field.[29]
The European Union economy consists of an internal market of mixed economies based on free market and advanced social models. For instance, it includes an internal single market with free movement of goods, services, capital, and labour.[30] The GDP per capita (PPP) was $56,970 in 2023 ,[31] compared to $80,410 in the United States, $52,120 in Japan and $28,800 in China.[32] There are significant disparities in GDP per capita (PPP) between member states ranging from $106,372 in Luxembourg to $23,169 in Bulgaria.[33] With a low Gini coefficient of 31, the European Union has a more egalitarian distribution of income than the world average.[34][35]
EU investments in foreign countries total $9.1 trillion, while the foreign investments made in the union total $5.1 trillion in 2012, by far the highest foreign and domestic investments in the world.[36][37] Euronext is the main stock exchange of the Eurozone and the world's fourth largest by market capitalisation.[38] The European Union's largest trading partners are China, the United States, the United Kingdom, Switzerland, Russia, Turkey, Japan, Norway, South Korea, India, and Canada.[39] In 2022, public debt in the union was 83.5% of GDP, with disparities between the lowest rate, Estonia with 18.5%, and the highest, Greece with 172.6%.[40]
- ^ "Population on 1 January by age and sex". ec.europa.eu/eurostat. Eurostat. 8 March 2024.
- ^ a b c d e "World Economic Outlook database: October 2022". IMF.org. International Monetary Fund. Retrieved 11 October 2022.
- ^ a b "World Economic Outlook Database, April 2020". EuroStat. Retrieved 16 April 2020.
- ^ a b c d "The World Factbook – Central Intelligence Agency". www.cia.gov. Retrieved 13 October 2016.
- ^ "People at risk of poverty or social exclusion". ec.europa.eu/eurostat. Eurostat. Retrieved 2 February 2020.
- ^ "Gini coefficient of equivalised disposable income – EU-SILC survey". ec.europa.eu/eurostat. Eurostat. Retrieved 9 May 2020.
- ^ a b "Inequalities in Human Development in the 21st Century" (PDF). UNDP. Retrieved 15 July 2020.
- ^ "Labor force, total - European Union". data.worldbank.org. World Bank. Retrieved 15 July 2020.
- ^ a b "Employment rate by sex, age group 20-64". ec.europa.eu/eurostat. Eurostat. Retrieved 15 May 2020.
- ^ a b "Unemployment by sex and age - monthly average". appsso.eurostat.ec.europa.eu. Eurostat. Retrieved 4 October 2020.
- ^ "New indicator on annual average salaries in the EU - Products Eurostat News - Eurostat". ec.europa.eu. Retrieved 11 March 2023.
- ^ "Database – Eurostat". ec.europa.eu.
- ^ a b c "Export and Import Partners of European Union". The World Factbook. CIA. 2015. Retrieved 10 July 2016.
- ^ a b "Client and Supplier Countries of the EU27 in Merchandise Trade (value %) (2021, excluding intra-EU trade)" (PDF). European Commission. 20 April 2022. Archived from the original (PDF) on 17 January 2017. Retrieved 7 September 2019.
- ^ "Eurostat – Tables, Graphs and Maps Interface (TGM) table". ec.europa.eu. Retrieved 15 October 2016.
- ^ "Eurostat – Tables, Graphs and Maps Interface (TGM) table". ec.europa.eu. Retrieved 15 October 2016.
- ^ "Balance of payment statistics – Statistics Explained". ec.europa.eu. Retrieved 15 October 2016.
- ^ "International investment position statistics – Statistics Explained". ec.europa.eu.
- ^ a b c d e f "Euro area government deficit at 5.1% and EU at 4.7% of GDP" (PDF). ec.europa.eu. Eurostat. Retrieved 15 September 2022.
- ^ Source: OECD: Financing for sustainable development; Table 1, page 6. Quote, page 3: "In 2015, total net ODA from the 28 EU member states was USD 74 billion, representing 0.47% of their GNI. Net disbursements by EU Institutions were USD 13.8 billion, a slight fall of 0.5% in real terms compared to 2014."
- ^ EU Institutions $13.85 billion, EU member states $73.80 billion.[20]
- ^ a b c "The EU as a borrower – European Commission". ec.europa.eu. Retrieved 15 October 2016.
- ^ "Scope affirms the European Union's and Euratom's AAA rating with Stable Outlook". Scope Ratings. Retrieved 22 September 2023.
- ^ "Foreign reserves and own funds". European Central Bank. Retrieved 15 October 2016.
- ^ "Report for Selected Country Groups and Subjects". www.imf.org. Retrieved 12 October 2022.
- ^ "Triennial Central Bank Survey 2007" (PDF). BIS. 19 December 2007. Retrieved 25 July 2009.
- ^ Aristovnik, Aleksander; Čeč, Tanja (30 March 2010). "Compositional Analysis of Foreign Currency Reserves in the 1999–2007 Period. The Euro vs. The Dollar As Leading Reserve Currency" (PDF). Munich Personal RePEc Archive, Paper No. 14350. Retrieved 27 December 2010.
- ^ Boesler, Matthew (11 November 2013). "There Are Only Two Real Threats to the US Dollar's Status As The International Reserve Currency". Business Insider. Retrieved 8 December 2013.
- ^ "All Laureates in Economics". Nobel Foundation. Archived from the original on 1 June 2013. Retrieved 14 October 2020.
- ^ "European Union - The World Factbook". www.cia.gov. 12 July 2022.
- ^ "World Economic Outlook Database, October 2019". IMF.org. International Monetary Fund. Retrieved 30 January 2020.
- ^ "World Economic Outlook Database, October 2019". www.imf.org. Retrieved 31 January 2020.
- ^ "World Economic Outlook Database, October 2019". IMF.org. International Monetary Fund. Retrieved 13 January 2020.
- ^ "Eurostat – Tables, Graphs and Maps Interface (TGM) table". ec.europa.eu. Retrieved 14 October 2016.
- ^ "GINI index (World Bank estimate) | Data". data.worldbank.org. Retrieved 14 October 2016.
- ^ "The World Factbook – Central Intelligence Agency". www.cia.gov. Archived from the original on 11 December 2007. Retrieved 12 October 2016.
- ^ "The World Factbook – Central Intelligence Agency". www.cia.gov. Archived from the original on 11 December 2007. Retrieved 12 October 2016.
- ^ "Monthly Reports". www.world-exchanges.org. Retrieved 12 October 2016.
- ^ Top Trading Partners Archived 17 January 2017 at the Wayback Machine Client and Supplier Countries of the EU28 in Merchandise Trade (value %) (2015, excluding intra-EU trade). Accessed 29 October 2018
- ^ "Eurostat – Tables, Graphs and Maps Interface (TGM) table". ec.europa.eu. Retrieved 17 December 2023.