 Global Information
Domapur information
Domapur
Domāpur | |
|---|---|
Village | |
 | |
 Map showing Domapur (#988) in Maharajganj CD block | |
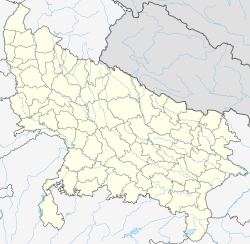 Domapur Location in Uttar Pradesh, India | |
| Coordinates: 26°22′26″N 81°21′22″E / 26.37401°N 81.356143°E[1] | |
| Country | |
| State | Uttar Pradesh |
| District | Raebareli |
| Area [2] | |
| • Total | 3.679 km2 (1.420 sq mi) |
| Population (2011)[2] | |
| • Total | 2,254 |
| • Density | 610/km2 (1,600/sq mi) |
| Languages | |
| • Official | Hindi |
| Time zone | UTC+5:30 (IST) |
| Vehicle registration | UP-35 |
Domapur is a village in Maharajganj block of Raebareli district, Uttar Pradesh, India.[2] As of 2011, its population is 2,254, in 404 households.[2] It has two primary schools and no healthcare facilities.[2] It is located 10 km from Maharajganj, the block headquarters.[3] The main staple foods are wheat and rice.[3] It belongs to the nyaya panchayat of Chandapur.[4]
The 1951 census recorded Domapur (as "Domanpur") as comprising 7 hamlets, with a total population of 904 people (473 male and 431 female), in 83 households and 74 physical houses.[5] The area of the village was given as 950 acres.[5] 28 residents were literate, 26 male and 2 female.[5] The village was listed as belonging to the pargana of Simrauta and the thana of Maharajganj.[5]
The 1961 census recorded Domapur (as "Domanpur") as comprising 7 hamlets, with a total population of 1,036 people (520 male and 516 female), in 209 households and 200 physical houses.[6] The area of the village was given as 950 acres.[6]
The 1981 census recorded Domapur (as "Domanpur") as having a population of 1,419 people, in 273 households, and having an area of 381.22 hectares.[3]
The 1991 census recorded Domapur as having a total population of 1,647 people (854 male and 793 female), in 309 households and 309 physical houses.[4] The area of the village was listed as 379 hectares.[4] Members of the 0-6 age group numbered 339, or 21% of the total; this group was 53% male (178) and 47% female (161).[4] Members of scheduled castes made up 31% of the village's population, while no members of scheduled tribes were recorded.[4] The literacy rate of the village was 14% (171 men and 53 women).[4] 464 people were classified as main workers (448 men and 16 women), while 319 people were classified as marginal workers (10 men and 309 women); the remaining 864 residents were non-workers.[4] The breakdown of main workers by employment category was as follows: 355 cultivators (i.e. people who owned or leased their own land); 63 agricultural labourers (i.e. people who worked someone else's land in return for payment); 2 workers in livestock, forestry, fishing, hunting, plantations, orchards, etc.; 0 in mining and quarrying; 7 household industry workers; 5 workers employed in other manufacturing, processing, service, and repair roles; 0 construction workers; 18 employed in trade and commerce; 0 employed in transport, storage, and communications; and 14 in other services.[4]
- ^ "Geographic Names Search WebApp". Do a radial search using these coordinates here.
- ^ a b c d e "Census of India 2011: Uttar Pradesh District Census Handbook - Rae Bareli, Part A (Village and Town Directory)" (PDF). Census 2011 India. pp. 108–24. Retrieved 29 July 2021.
- ^ a b c Census 1981 Uttar Pradesh: District Census Handbook Part XIII-A: Village & Town Directory, District Rae Bareli (PDF). 1982. pp. 54–5. Retrieved 29 July 2021.
- ^ a b c d e f g h Census 1991 Series-25 Uttar Pradesh Part-XII B Village & Townwise Primary Census Abstract District Census Handbook District Raebareli (PDF). 1992. pp. xxiv–xxviii, 54–5. Retrieved 22 October 2021.
- ^ a b c d Census of India, 1951: District Census Handbook Uttar Pradesh (42 - Rae Bareli District) (PDF). Allahabad. 1955. pp. 126–7. Retrieved 22 October 2021.
{{cite book}}: CS1 maint: location missing publisher (link) - ^ a b Census 1961: District Census Handbook, Uttar Pradesh (39 - Raebareli District) (PDF). Lucknow. 1965. pp. xii-xiii of section "Maharajganj Tahsil". Retrieved 29 July 2021.
{{cite book}}: CS1 maint: location missing publisher (link)