Computer program used to test and debug other programs
This article has multiple issues. Please help improve it or discuss these issues on the talk page. (Learn how and when to remove these template messages)
This article includes a list of general references, but it lacks sufficient corresponding inline citations. Please help to improve this article by introducing more precise citations.(May 2013) (Learn how and when to remove this message)
This article relies largely or entirely on a single source. Relevant discussion may be found on the talk page. Please help improve this article by introducing citations to additional sources. Find sources: "Debugger" – news · newspapers · books · scholar · JSTOR(May 2015)
This article needs additional citations for verification. Please help improve this article by adding citations to reliable sources. Unsourced material may be challenged and removed. Find sources: "Debugger" – news · newspapers · books · scholar · JSTOR(April 2008) (Learn how and when to remove this message)
(Learn how and when to remove this message)
Part of a series on
Software development
Core activities
Data modeling
Processes
Requirements
Design
Construction
Engineering
Testing
Debugging
Deployment
Maintenance
Paradigms and models
Agile
Cleanroom
Incremental
Prototyping
Spiral
V model
Waterfall
Methodologies and frameworks
ASD
DevOps
DAD
DSDM
FDD
IID
Kanban
Lean SD
LeSS
MDD
MSF
PSP
RAD
RUP
SAFe
Scrum
SEMAT
TDD
TSP
OpenUP
UP
XP
Supporting disciplines
Configuration management
Documentation
Software quality assurance
Project management
User experience
Practices
ATDD
BDD
CCO
CI
CD
DDD
PP
SBE
Stand-up
TDD
Tools
Compiler
Debugger
Profiler
GUI designer
UML Modeling
IDE
Build automation
Release automation
Infrastructure as code
Standards and bodies of knowledge
CMMI
IEEE standards
ISO 9001
ISO/IEC standards
PMBOK
SWEBOK
ITIL
IREB
OMG
Glossaries
Artificial intelligence
Computer science
Electrical and electronics engineering
Outlines
Outline of software development
v
t
e
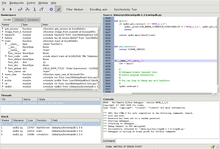
Winpdb debugging itself
A debugger or debugging tool is a computer program used to test and debug other programs (the "target" program). The main use of a debugger is to run the target program under controlled conditions that permit the programmer to track its execution and monitor changes in computer resources that may indicate malfunctioning code. Typical debugging facilities include the ability to run or halt the target program at specific points, display the contents of memory, CPU registers or storage devices (such as disk drives), and modify memory or register contents in order to enter selected test data that might be a cause of faulty program execution.
The code to be examined might alternatively be running on an instruction set simulator (ISS), a technique that allows great power in its ability to halt when specific conditions are encountered, but which will typically be somewhat slower than executing the code directly on the appropriate (or the same) processor. Some debuggers offer two modes of operation, full or partial simulation, to limit this impact.
A "trap" occurs when the program cannot normally continue because of a programming bug or invalid data. For example, the program might have tried to use an instruction not available on the current version of the CPU or attempted to access unavailable or protected memory. When the program "traps" or reaches a preset condition, the debugger typically shows the location in the original code if it is a source-level debugger or symbolic debugger, commonly now seen in integrated development environments. If it is a low-level debugger or a machine-language debugger it shows the line in the disassembly (unless it also has online access to the original source code and can display the appropriate section of code from the assembly or compilation).
A debugger or debugging tool is a computer program used to test and debug other programs (the "target" program). The main use of a debugger is to run...
The GNU Debugger (GDB) is a portable debugger that runs on many Unix-like systems and works for many programming languages, including Ada, Assembly, C...
"SuperTrace Probe hardware debugger". www.ghs.com. Archived from the original on 2017-12-01. Retrieved 2017-11-25. "Debugger and real-time trace tools"...
This is a list of debuggers: computer programs that are used to test and debug other programs. Advanced Debugger — an older UNIX debugger dating back to...
as code refactoring. The integrated debugger works as both a source-level debugger and as a machine-level debugger. Other built-in tools include a code...
The advanced[citation needed] debugger adb is a debugger that first appeared in Seventh Edition UNIX. It is found on Solaris, HP-UX, SCO and Venix. It...
- Time Travel Debugger for C/C++". "ProvTools/provDebugR". github.com. 2018-07-31. Retrieved 2018-07-31. "PyTrace Time Travel Debugger for Python". "Wallaby...
A memory debugger is a debugger for finding software memory problems such as memory leaks and buffer overflows. These are due to bugs related to the allocation...
Script Debugger now allowed inspection of running applications to see what events they were emitting. The new utility also contained a full debugger, with...
like Emacs or Vim. Data Display Debugger is intended to be an advanced graphical front-end for many text-based debugger standard tools. Some programmers...
debugger is a debugger present in some operating system kernels to ease debugging and kernel development by the kernel developers. A kernel debugger might...
extensions to the Visual Studio Debugger. The parallel debugger extension enables additional capabilities for debugging parallel programs and is available...
In software engineering, rubber duck debugging (or rubberducking) is a method of debugging code by articulating a problem in spoken or written natural...
The Jasik Debugger (or more correctly, The Debugger from Jasik Designs), was a debugger tool for the classic Mac OS. Pitched as a much more powerful alternative...
these groups is the "Silent Debuggers". Powerful and mysterious, now the government calls upon them again. As an aspiring Debugger with your sidekick Leon...
HP Wildebeest Debugger, XDB, the Perl debugger, the Bash debugger, the Python debugger, and the GNU Make debugger. DDD is part of the GNU Project and distributed...
The Java Platform Debugger Architecture (JPDA) is a collection of APIs to debug Java code. Java Debugger Interface (JDI) – defines a high-level Java language...
This is a comparison of debuggers: computer programs that are used to test and debug other programs. List of debuggers "TotalView 8.15.10 Platforms and...
format of debug symbols. This allows any compatible compiler or assembler to create debug symbols in a standardized format, and for any debugger, such as...
web browser has built-in web development tools, including a JavaScript debugger. Static program analysis tools, such as ESLint and JSLint, scan JavaScript...
A debug menu or debug mode is a user interface implemented in a computer program that allows the user to view and/or manipulate the program's internal...
the ARM Debug Interface v5. This enables the debugger to become another AMBA bus master for access to system memory and peripheral or debug registers...
Turbo Debugger (TD) is a machine-level debugger for DOS executables, intended mainly for debugging Borland Turbo Pascal, and later Turbo C programs, sold...
 Global Information