Graph of polyprotic acid concentration compared to pH
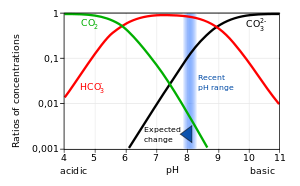
Example Bjerrum plot: Change in carbonate system of seawater from ocean acidification.
A Bjerrum plot (named after Niels Bjerrum), sometimes also known as a Sillén diagram (after Lars Gunnar Sillén), or a Hägg diagram (after Gunnar Hägg)[1] is a graph of the concentrations of the different species of a polyprotic acid in a solution, as a function of pH,[2] when the solution is at equilibrium. Due to the many orders of magnitude spanned by the concentrations, they are commonly plotted on a logarithmic scale. Sometimes the ratios of the concentrations are plotted rather than the actual concentrations. Occasionally H+ and OH− are also plotted.
Most often, the carbonate system is plotted, where the polyprotic acid is carbonic acid (a diprotic acid), and the different species are dissolved carbon dioxide, carbonic acid, bicarbonate, and carbonate. In acidic conditions, the dominant form is CO2; in basic (alkaline) conditions, the dominant form is CO2− 3; and in between, the dominant form is HCO− 3. At every pH, the concentration of carbonic acid is assumed to be negligible compared to the concentration of dissolved CO 2, and so is often omitted from Bjerrum plots. These plots are very helpful in solution chemistry and natural water chemistry. In the example given here, it illustrates the response of seawater pH and carbonate speciation due to the input of man-made CO 2 emission by the fossil fuel combustion.[3]
The Bjerrum plots for other polyprotic acids, including silicic, boric, sulfuric and phosphoric acids, are other commonly used examples.[2]
^Togni, Antonio (2022-05-25). "Teaching Acid-Base Equilibria by Using Log-log Diagrams: Chemical Education". CHIMIA. 76 (5): 481. doi:10.2533/chimia.2022.481. hdl:20.500.11850/557050. ISSN 2673-2424.
^ abAndersen, C. B. (2002). "Understanding carbonate equilibria by measuring alkalinity in experimental and natural systems". Journal of Geoscience Education. 50 (4): 389–403. Bibcode:2002JGeEd..50..389A. doi:10.5408/1089-9995-50.4.389. S2CID 17094010.
^D.A. Wolf-Gladrow (2007). "Total alkalinity: the explicit conservative expression and its application to biogeochemical processes" (PDF). Marine Chemistry. 106 (1): 287–300. Bibcode:2007MarCh.106..287W. doi:10.1016/j.marchem.2007.01.006.
A Bjerrumplot (named after Niels Bjerrum), sometimes also known as a Sillén diagram (after Lars Gunnar Sillén), or a Hägg diagram (after Gunnar Hägg)...
the Bjerrum length, and the Bjerrumplot. Bjerrum also performed some of the first research on the measurement of soil acidity. His son Jannik Bjerrum (1909–1992)...
that carbonic acid will be almost 50%-dissociated at equilibrium. The Bjerrumplot shows typical equilibrium concentrations, in solution, in seawater, of...
factors such as seawater temperature, pressure and salinity (as shown in a Bjerrumplot). These different forms of dissolved inorganic carbon are transferred...
the added concentration of HCO−3 (which constitutes more than 90% of Bjerrumplot species from pH 7 to pH 8 at 25 °C in fresh water). Addition of HCO−3...
HCO−3 (bicarbonate) and CO2−3(carbonate) depend on the pH. As shown in a Bjerrumplot, in neutral or slightly alkaline water (pH > 6.5), the bicarbonate form...
species is dominant) depends on the pH of the solution, as shown by a Bjerrumplot. Total inorganic carbon is typically measured by the acidification of...
Ellingham diagram Latimer diagram Frost diagram Ionic partition diagram Bjerrumplot Though it can be expanded and calculated. : 111 This is possible to...
2-}]}}}\end{aligned}}} A plot of these fractional concentrations against pH, for given K1 and K2, is known as a Bjerrumplot. A pattern is observed in...
of carbon dioxide), is dependent on factors such as pH, as shown in a Bjerrumplot. In seawater this is regulated by the charge balance of a number of positive...
waters are dependent on the pH of the system, and are illustrated by the Bjerrumplot below (Figure 1). Carbonate is dominant in higher pH (basic) environments...
sequestration of carbon from the atmosphere to deep sea water and sediment Bjerrumplot – A graph of the concentrations of the different species of a polyprotic...
programs for calculating species concentrations in chemical equilibrium. Bjerrumplot Charlot equation Henderson–Hasselbalch equation Butler, James N. (1998)...
[HA] and [A−] into the equation for [H+] yields the Charlot equation. Bjerrumplot Charlot, Gaston (1947). "Utilité de la définition de Brönsted des acides...
global ocean or of an ocean basin at a point in geological history. From Bjerrumplots, it is found that a decrease in the salinity of an aqueous fluid will...
October 2020. Retrieved 22 October 2019. Rosing MT, Bird DK, Sleep NH, Bjerrum CJ (April 2010). "No climate paradox under the faint early Sun". Nature...
the sample is heated strongly, and the accurate weight of a sample is plotted against the temperature. The amount of water driven off is then divided...
Arthur W. Conway, Penry Vaughan Bevan, John William Nicholson, and Niels Bjerrum. Chapter five switches to gravitation, discussing the history of cosmology...
 Global Information